 Suphan Buri has been prosperous since the Dvaravati and was formerly called
Phanchum Buri. It was constructed during the year 877-882 A.D. on the left
bank of Tha Chin River in the vicinity of Tambon Rua Yai adjacent to Tambon
Phihan Daeng. Later on when the Phanchum era was over, King Katae (half
Thaihalf Burmese) was crowned and after ascending to the throne he commanded
the town to be moved to the right bank of the Tha Chin River, to construct
Wat Sanam Chai and to restore Wat Pa Leylai. He then persuaded 2,000 officials
to enter the monkhood. The name of the town was then changed to be Song
Phan Buri (city of two thousands)
Suphan Buri has been prosperous since the Dvaravati and was formerly called
Phanchum Buri. It was constructed during the year 877-882 A.D. on the left
bank of Tha Chin River in the vicinity of Tambon Rua Yai adjacent to Tambon
Phihan Daeng. Later on when the Phanchum era was over, King Katae (half
Thaihalf Burmese) was crowned and after ascending to the throne he commanded
the town to be moved to the right bank of the Tha Chin River, to construct
Wat Sanam Chai and to restore Wat Pa Leylai. He then persuaded 2,000 officials
to enter the monkhood. The name of the town was then changed to be Song
Phan Buri (city of two thousands)
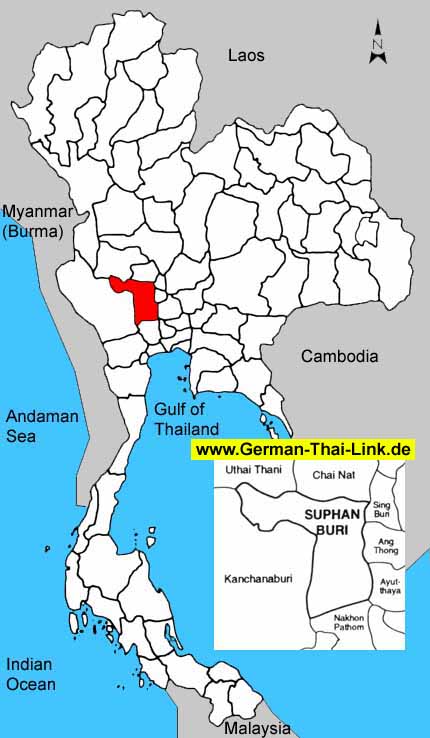
Later on, King U Thong moved the location to the southem bank (West of
Tha Chin River). The city was given a new name as U Thong until the reign
of King Khun Luang Pha Ngua when the name was changed to Suphan Buri.
Suphan Buri had been an important border town, involving battles and
wars. This caused regular damage through all ages in the past until the
Ratanakosin era during the reign of King Rama VI. Then the Suphan Buri
communities were consolidated and settled down on the east bank of the
Tha Chin River (Suphan River) as it is now.
Suphan Buri is located some 169 kilometers from Bankok (approximately
100 kilmeters through the new Nonthaburi-Suphan Buri Highway)
|
| General
Information |
| Area
sq km |
5,358
|
|
|
Anual
rainfall mm (2002) |
881
|
| Forest
Land (1999) |
560
|
10.5 %
|
Days
of rain (2002) |
110
|
| Farm
Land (1999) |
3,331
|
62.2 %
|
Mean
Temperature High/Low (2002) |
34.0
/
24.5
|
| Unclassified
Land (1999) |
1,467
|
27.4 %
|
BOI
Zone |
3
|
| Population
/ sq. km (2003) |
162
|
|
Gross
provincial product rank (2001) |
22
|
|
|
| Population |
2003 |
2002 |
2001 |
2000 |
1999 |
1998 |
1997 |
1996 |
| Male |
48.7 %
|
48.7 %
|
48.7 %
|
48.7 %
|
48.8 %
|
48.9 %
|
48.9 %
|
48.9 %
|
| Female |
51.3 %
|
51.3 %
|
51.3 %
|
51.3 %
|
51.2 %
|
51.1 %
|
51.1 %
|
51.1 %
|
| Total |
868,681
|
863,304
|
859,905
|
858,201
|
855,823
|
858,750
|
853,313
|
847,876
|
|
|
| Household
income (baht) |
2002 |
2000 |
1998 |
1996 |
1994 |
| Average
monthly income |
12,984
|
13,334
|
12,409
|
7,428
|
7,979
|
| Average
monthly expenditures |
9,783
|
6,392
|
9,258
|
6,643
|
6,261
|
| Voluntary
reserves |
24.7 %
|
52.1 %
|
25.4 %
|
10.6 %
|
21.5 %
|
| Monthly
income / Person |
3,818
|
3,809
|
3,353
|
2,007
|
2,099
|
| Average
household size |
3.4
|
3.5
|
3.7
|
3.7
|
3.8
|
|
|
| Gross
provincial product |
2001 |
2000 |
1999 |
1998 |
1997 |
1996 |
1995 |
1994 |
| Agriculture |
22.5 %
|
21.8 %
|
24.8 %
|
28.3 %
|
25.8 %
|
24.5 %
|
23.1 %
|
21.1 %
|
| Manufacturing |
25.9 %
|
25.0 %
|
22.5 %
|
22.0 %
|
20.3 %
|
19.9 %
|
19.6 %
|
21.2 %
|
| Construction |
2.7 %
|
4.7 %
|
4.6 %
|
4.5 %
|
6.3 %
|
7.9 %
|
7.3 %
|
6.4 %
|
| Transport
& communication |
3.6 %
|
3.4 %
|
3.3 %
|
3.0 %
|
3.1 %
|
3.4 %
|
2.9 %
|
3.1 %
|
| Wholesale
& retail trade |
17.6 %
|
17.6 %
|
17.2 %
|
16.0 %
|
18.2 %
|
17.7 %
|
19.7 %
|
20.1 %
|
| Services |
9.9 %
|
9.4 %
|
9.3 %
|
8.2 %
|
8.4 %
|
8.2 %
|
8.3 %
|
8.4 %
|
| Others |
17.8 %
|
18.1 %
|
18.3 %
|
18.0 %
|
17.9 %
|
18.4 %
|
19.1 %
|
19.7 %
|
|
|
|
|
|
|
|
|
|
| Total
(million baht) |
43,042
|
43,250
|
42,115
|
43,394
|
41,632
|
39,633
|
34,357
|
29,803
|
| GPP
per capita (baht) |
50,054
|
50,396
|
49,209
|
50,531
|
48,788
|
46,743
|
40,593
|
35,452
|
|
|
| Commercial
bank |
2003 |
2002 |
2001 |
2000 |
1999 |
1998 |
1997 |
1996 |
| No.
of offices |
39
|
41
|
43
|
45
|
43
|
43
|
47
|
45
|
| Deposits
(million baht) |
24,260
|
23,512
|
24,196
|
22,683
|
23,448
|
23,448
|
23,048
|
21,985
|
| Loans
(million baht) |
16,450
|
14,077
|
13,096
|
15,527
|
17,870
|
17,870
|
20,650
|
19,662
|
| Deposits
/ capita (baht) |
28,268
|
27,472
|
28,175
|
26,582
|
27,654
|
27,704
|
27,417
|
26,050
|
| Loans/deposits
ratio |
67.8 %
|
59.9 %
|
54.1 %
|
68.5 %
|
76.2 %
|
76.2 %
|
89.6 %
|
89.4 %
|
|
|
| Public
health |
2001 |
2000 |
1999 |
1998 |
1997 |
1996 |
1995 |
1994 |
1993 |
| No.
of hospitals |
19
|
17
|
18
|
18
|
18
|
18
|
18
|
21
|
17
|
| No.
of hospital beds |
1,764
|
1,628
|
1,495
|
1,495
|
1,371
|
1,239
|
1,108
|
1,124
|
961
|
| Avg.
Beds / Hospital |
92
|
95
|
83
|
83
|
76
|
68
|
61
|
53
|
56
|
| Capita
/ Hospital bed |
487
|
527
|
572
|
574
|
622
|
684
|
763
|
747
|
878
|
| No.
of physicians |
156
|
133
|
138
|
149
|
93
|
106
|
120
|
94
|
95
|
| Capita
/ Physician |
5,512
|
6,452
|
6,201
|
5,763
|
9,175
|
7,998
|
7,053
|
8,943
|
8,883
|
|
No. of dentists |
31
|
31
|
29
|
31
|
18
|
27
|
36
|
35
|
26
|
|
Capita / Dentist |
27,738
|
27,683
|
29,511
|
27,701
|
47,406
|
31,402
|
23,510
|
24,018
|
32,458
|
| No.
of nurses |
906
|
769
|
773
|
682
|
538
|
544
|
550
|
528
|
464
|
|
|
| Education |
2002 |
2000 |
1998 |
1996 |
1994 |
1993 |
| No.
of teachers |
-
|
7,437
|
7,425
|
6,832
|
7,044
|
6,845
|
| No.
of students |
-
|
146,964
|
146,964
|
145,284
|
145,768
|
136,356
|
| No.
of schools |
-
|
520
|
525
|
527
|
515
|
516
|
| No.
of classrooms |
-
|
5,935
|
5,958
|
5,822
|
5,979
|
5,587
|
| Ratio
: students / teacher |
-
|
19.8
|
19.8
|
21.3
|
20.7
|
19.9
|
| Ratio
: students / classroom |
-
|
24.8
|
24.7
|
25.0
|
24.4
|
24.4
|
|
|
| |
|

