|
| General
Information |
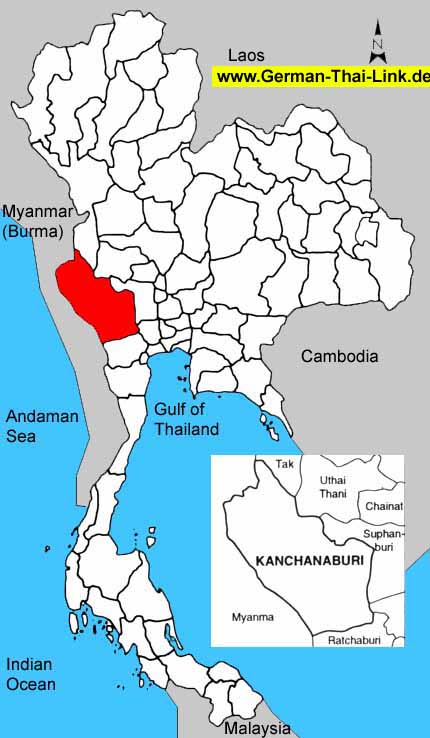
| Area
sq km |
19,483
|
|
|
Anual
rainfall mm (2002) |
992
|
| Forest
Land (1999) |
10,485
|
53.8 %
|
Days
of rain (2002) |
114
|
| Farm
Land (1999) |
3,168
|
16.3 %
|
Mean
Temperature High/Low (2002) |
34.1
/
24.4
|
| Unclassified
Land (1999) |
5,830
|
29.9 %
|
BOI
Zone |
2
|
| Population
/ sq. km (2003) |
40
|
|
Gross
provincial product rank (2001) |
19
|
|
|
| Population |
2003 |
2002 |
2001 |
2000 |
1999 |
1998 |
1997 |
1996 |
| Male |
50.5 %
|
50.6 %
|
50.7 %
|
50.7 %
|
50.8 %
|
50.8 %
|
50.9 %
|
51.0 %
|
| Female |
49.5 %
|
49.4 %
|
49.3 %
|
49.3 %
|
49.2 %
|
49.2 %
|
49.1 %
|
49.0 %
|
| Total |
797,339
|
801,836
|
792,294
|
786,001
|
778,456
|
775,198
|
766,352
|
756,528
|
|
|
| Household
income (baht) |
2002 |
2000 |
1998 |
1996 |
1994 |
| Average
monthly income |
15,380
|
11,680
|
13,082
|
10,230
|
7,299
|
| Average
monthly expenditures |
9,702
|
8,683
|
10,143
|
9,710
|
6,730
|
| Voluntary
reserves |
36.9 %
|
25.7 %
|
22.5 %
|
5.1 %
|
7.8 %
|
| Monthly
income / Person |
4,272
|
3,156
|
3,442
|
2,623
|
1,920
|
| Average
household size |
3.6
|
3.7
|
3.8
|
3.9
|
3.8
|
|
|
| Gross
provincial product |
2001 |
2000 |
1999 |
1998 |
1997 |
1996 |
1995 |
1994 |
| Agriculture |
18.4 %
|
14.8 %
|
14.4 %
|
17.8 %
|
17.0 %
|
17.8 %
|
16.6 %
|
17.2 %
|
| Manufacturing |
22.8 %
|
22.4 %
|
22.4 %
|
21.7 %
|
19.1 %
|
18.6 %
|
17.3 %
|
17.7 %
|
| Construction |
3.1 %
|
4.1 %
|
4.7 %
|
4.7 %
|
6.6 %
|
7.7 %
|
8.8 %
|
8.1 %
|
| Transport
& communication |
6.4 %
|
7.4 %
|
9.3 %
|
9.5 %
|
10.3 %
|
19.0 %
|
10.0 %
|
11.0 %
|
| Wholesale
& retail trade |
18.9 %
|
20.8 %
|
19.2 %
|
18.7 %
|
19.9 %
|
19.0 %
|
19.4 %
|
20.0 %
|
| Services |
12.4 %
|
12.0 %
|
11.4 %
|
10.2 %
|
9.3 %
|
9.7 %
|
10.3 %
|
8.5 %
|
| Others |
18.0 %
|
18.5 %
|
18.6 %
|
17.4 %
|
17.8 %
|
8.2 %
|
17.6 %
|
17.5 %
|
|
|
|
|
|
|
|
|
|
| Total
(million baht) |
46,131
|
44,380
|
45,224
|
44,090
|
44,482
|
42,564
|
39,578
|
33,704
|
| GPP
per capita (baht) |
58,224
|
56,463
|
58,094
|
56,875
|
58,043
|
56,262
|
52,444
|
45,147
|
|
|
| Commercial
bank |
2003 |
2002 |
2001 |
2000 |
1999 |
1998 |
1997 |
1996 |
| No.
of offices |
33
|
32
|
32
|
38
|
34
|
34
|
36
|
36
|
| Deposits
(million baht) |
19,607
|
18,996
|
19,654
|
18,599
|
19,244
|
19,244
|
19,503
|
18,409
|
| Loans
(million baht) |
11,859
|
11,245
|
11,107
|
13,850
|
14,530
|
14,530
|
18,218
|
17,917
|
| Deposits
/ capita (baht) |
24,945
|
24,402
|
25,353
|
24,269
|
25,437
|
25,500
|
26,125
|
25,037
|
| Loans/deposits
ratio |
60.5 %
|
59.2 %
|
56.5 %
|
74.5 %
|
75.5 %
|
75.5 %
|
93.4 %
|
97.3 %
|
|
|
| Public
health |
2001 |
2000 |
1999 |
1998 |
1997 |
1996 |
1995 |
1994 |
1993 |
| No.
of hospitals |
21
|
20
|
21
|
21
|
24
|
21
|
19
|
17
|
17
|
| No.
of hospital beds |
1,520
|
1,497
|
1,465
|
1,429
|
1,402
|
1,262
|
1,122
|
932
|
1,012
|
| Avg.
Beds / Hospital |
72
|
74
|
69
|
68
|
58
|
60
|
59
|
54
|
59
|
| Capita
/ Hospital bed |
521
|
525
|
531
|
542
|
546
|
599
|
672
|
800
|
726
|
| No.
of physicians |
145
|
166
|
112
|
116
|
124
|
107
|
90
|
80
|
79
|
| Capita
/ Physician |
5,464
|
4,734
|
6,950
|
6,682
|
6,180
|
7,070
|
8,385
|
9,331
|
9,307
|
|
No. of dentists |
37
|
33
|
29
|
33
|
28
|
26
|
24
|
21
|
18
|
|
Capita / Dentist |
21,413
|
23,818
|
26,843
|
23,490
|
27,369
|
29,097
|
31,444
|
35,548
|
40,847
|
| No.
of nurses |
789
|
773
|
616
|
556
|
574
|
519
|
465
|
418
|
360
|
|
|
| Education |
2002 |
2000 |
1998 |
1996 |
1994 |
1993 |
| No.
of teachers |
-
|
7,008
|
7,025
|
7,071
|
6,778
|
6,667
|
| No.
of students |
-
|
150,256
|
145,687
|
139,942
|
129,319
|
124,465
|
| No.
of schools |
-
|
527
|
536
|
535
|
535
|
535
|
| No.
of classrooms |
-
|
5,500
|
5,490
|
5,490
|
5,174
|
5,035
|
| Ratio
: students / teacher |
-
|
21.4
|
20.7
|
19.8
|
19.1
|
18.7
|
| Ratio
: students / classroom |
-
|
27.3
|
26.5
|
25.5
|
25.0
|
24.7
|
|
|
| |
|

