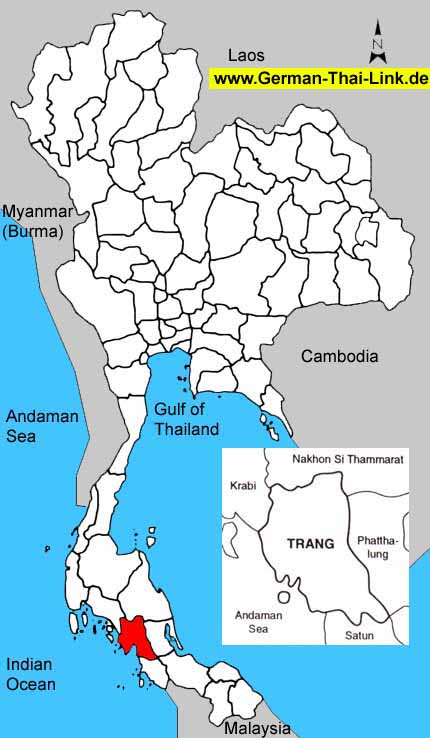
Trang or Tab Tiang Town is located some 828 kms. from Bangkok. It is
another big city of the South, being the communication center to Nakhon
Si Thammarat. Rubber plants have been firstly grown in this province by
Phraya Rasdanupradit Mahissara Phakdi who got the seedling stocks from
Malaysia. It had been a sea port of Thailand's west coast on the seashore
of the Indian Ocean in the old days.
Monument of Phraya Rasdanupradit Mahitsara Phakdi This is the monument
of a ruler of Trang in the past who firstly initiated the idea of growing
rubber plants in Trang as the first place in Thailand, located one kilometers
out of Trang township area on the highway to Phattalung.
Khao Chong Forest Park It is located near Trang-Phattalung Highway, 20
kms. from the township area. The park is one of the most beautiful and
attractive places in the South. There are two streams and waterfalls,
they are: Nam Tok Ton Yai and Nam Tok Ton Noi.
Hat Chao Mai National Park It is located in Tambon Ko Libong, Amphoe
Kantang, on the route Trang-Sikao, pass through Banna, Muang Phet and
Bo Nam Ron, 50 kms. from Trang township area. The National Park comprises
Hat Chao Mai and Hat Chang Lang and the office of the national park is
in the area of Hat Chang Lang.
|
| General
Information |
| Area
sq km |
4,918
|
|
|
Anual
rainfall mm (2002) |
1,638
|
| Forest
Land (1999) |
931
|
18.9 %
|
Days
of rain (2002) |
158
|
| Farm
Land (1999) |
2,457
|
50.0 %
|
Mean
Temperature High/Low (2002) |
33.6
/
23.1
|
| Unclassified
Land (1999) |
1,530
|
31.1 %
|
BOI
Zone |
3
|
| Population
/ sq. km (2003) |
123
|
|
Gross
provincial product rank (2001) |
39
|
|
|
| Population |
2003 |
2002 |
2001 |
2000 |
1999 |
1998 |
1997 |
1996 |
| Male |
49.5 %
|
49.6 %
|
49.6 %
|
49.6 %
|
49.7 %
|
49.7 %
|
49.7 %
|
0.0 %
|
| Female |
50.5 %
|
50.4 %
|
50.4 %
|
50.4 %
|
50.3 %
|
50.3 %
|
50.3 %
|
100.0 %
|
| Total |
608,044
|
603,072
|
596,673
|
590,851
|
587,930
|
584,154
|
576,060
|
564,660
|
|
|
| Household
income (baht) |
2002 |
2000 |
1998 |
1996 |
1994 |
| Average
monthly income |
14,332
|
12,782
|
12,973
|
11,733
|
8,111
|
| Average
monthly expenditures |
11,208
|
9,888
|
11,274
|
9,966
|
7,103
|
| Voluntary
reserves |
21.8 %
|
22.6 %
|
13.1 %
|
15.1 %
|
12.4 %
|
| Monthly
income / Person |
3,674
|
3,277
|
3,243
|
2,861
|
1,931
|
| Average
household size |
3.9
|
3.9
|
4.0
|
4.1
|
4.2
|
|
|
| Gross
provincial product |
2001 |
2000 |
1999 |
1998 |
1997 |
1996 |
1995 |
1994 |
| Agriculture |
45.5 %
|
46.2 %
|
44.1 %
|
51.2 %
|
45.5 %
|
47.2 %
|
49.1 %
|
47.1 %
|
| Manufacturing |
6.4 %
|
6.2 %
|
5.7 %
|
4.8 %
|
5.1 %
|
4.9 %
|
4.5 %
|
4.3 %
|
| Construction |
2.3 %
|
2.5 %
|
3.1 %
|
2.4 %
|
4.6 %
|
7.3 %
|
6.4 %
|
6.1 %
|
| Transport
& communication |
3.9 %
|
3.8 %
|
3.8 %
|
3.8 %
|
4.3 %
|
4.0 %
|
3.8 %
|
4.1 %
|
| Wholesale
& retail trade |
14.4 %
|
15.1 %
|
15.5 %
|
11.8 %
|
14.4 %
|
13.1 %
|
13.5 %
|
15.0 %
|
| Services |
12.9 %
|
12.4 %
|
12.5 %
|
10.0 %
|
10.6 %
|
9.5 %
|
9.6 %
|
10.0 %
|
| Others |
14.6 %
|
13.8 %
|
15.3 %
|
16.0 %
|
15.5 %
|
14.0 %
|
13.1 %
|
13.4 %
|
|
|
|
|
|
|
|
|
|
| Total
(million baht) |
28,449
|
28,240
|
25,855
|
30,232
|
26,978
|
27,903
|
26,079
|
20,961
|
| GPP
per capita (baht) |
47,679
|
47,795
|
43,976
|
51,753
|
46,831
|
49,415
|
45,880
|
37,389
|
|
|
| Commercial
bank |
2003 |
2002 |
2001 |
2000 |
1999 |
1998 |
1997 |
1996 |
| No.
of offices |
27
|
27
|
26
|
27
|
24
|
24
|
27
|
27
|
| Deposits
(million baht) |
19,648
|
18,898
|
18,231
|
16,406
|
15,940
|
15,940
|
15,318
|
14,372
|
| Loans
(million baht) |
9,465
|
8,508
|
8,123
|
10,350
|
10,770
|
10,770
|
12,672
|
12,623
|
| Deposits
/ capita (baht) |
33,253
|
32,143
|
31,209
|
28,479
|
28,229
|
28,043
|
27,323
|
26,079
|
| Loans/deposits
ratio |
48.2 %
|
45.0 %
|
44.6 %
|
63.1 %
|
67.6 %
|
67.6 %
|
82.7 %
|
87.8 %
|
|
|
| Public
health |
2001 |
2000 |
1999 |
1998 |
1997 |
1996 |
1995 |
1994 |
1993 |
| No.
of hospitals |
14
|
15
|
15
|
14
|
16
|
15
|
14
|
13
|
12
|
| No.
of hospital beds |
1,005
|
1,156
|
1,125
|
1,095
|
1,278
|
1,171
|
1,065
|
815
|
785
|
| Avg.
Beds / Hospital |
71
|
77
|
75
|
78
|
79
|
78
|
76
|
62
|
65
|
| Capita
/ Hospital bed |
593
|
511
|
522
|
533
|
450
|
482
|
533
|
687
|
702
|
| No.
of physicians |
121
|
112
|
110
|
122
|
87
|
81
|
76
|
75
|
64
|
| Capita
/ Physician |
4,931
|
5,275
|
5,344
|
4,788
|
6,621
|
6,971
|
7,479
|
7,474
|
8,610
|
|
No. of dentists |
33
|
28
|
29
|
24
|
18
|
16
|
14
|
15
|
9
|
|
Capita / Dentist |
18,081
|
21,101
|
20,273
|
24,339
|
32,003
|
35,291
|
40,600
|
37,374
|
61,231
|
| No.
of nurses |
675
|
611
|
535
|
479
|
426
|
386
|
347
|
323
|
280
|
|
|
| Education |
2002 |
2000 |
1998 |
1996 |
1994 |
1993 |
| No.
of teachers |
-
|
6,350
|
6,405
|
6,243
|
6,036
|
5,866
|
| No.
of students |
-
|
126,975
|
128,538
|
127,190
|
120,767
|
116,880
|
| No.
of schools |
-
|
397
|
406
|
407
|
401
|
422
|
| No.
of classrooms |
-
|
4,653
|
4,664
|
4,595
|
4,171
|
4,379
|
| Ratio
: students / teacher |
-
|
20.0
|
20.1
|
20.4
|
20.0
|
19.9
|
| Ratio
: students / classroom |
-
|
27.3
|
27.6
|
27.7
|
29.0
|
26.7
|
|
|
| |
|

