|
| General
Information |
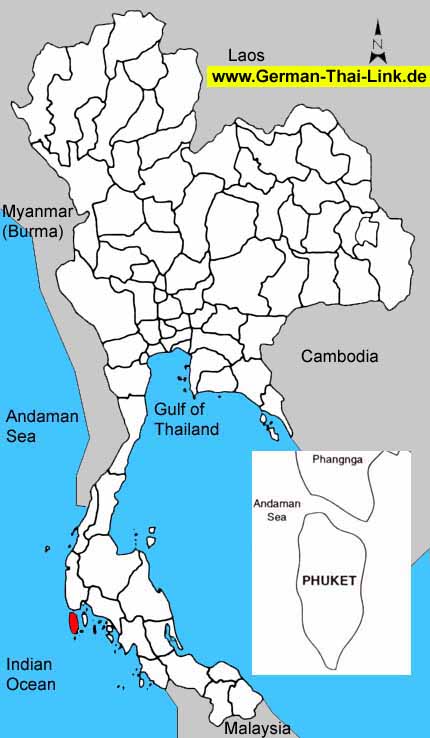
| Area
sq km |
543
|
|
|
Anual
rainfall mm (2002) |
1,967
|
| Forest
Land (1999) |
24
|
4.4 %
|
Days
of rain (2002) |
157
|
| Farm
Land (1999) |
226
|
41.6 %
|
Mean
Temperature High/Low (2002) |
32.6
/
25.8
|
| Unclassified
Land (1999) |
293
|
54.0 %
|
BOI
Zone |
3
|
| Population
/ sq. km (2003) |
512
|
|
Gross
provincial product rank (2001) |
20
|
|
|
| Population |
2003 |
2002 |
2001 |
2000 |
1999 |
1998 |
1997 |
1996 |
| Male |
48.4 %
|
48.5 %
|
48.6 %
|
48.9 %
|
49.1 %
|
49.4 %
|
49.5 %
|
49.5 %
|
| Female |
51.6 %
|
51.5 %
|
51.4 %
|
51.1 %
|
50.9 %
|
50.6 %
|
50.5 %
|
50.5 %
|
| Total |
278,480
|
270,438
|
261,386
|
250,596
|
241,489
|
231,206
|
221,835
|
214,633
|
|
|
| Household
income (baht) |
2002 |
2000 |
1998 |
1996 |
1994 |
| Average
monthly income |
26,363
|
20,702
|
19,313
|
15,437
|
16,017
|
| Average
monthly expenditures |
18,689
|
18,054
|
16,864
|
14,006
|
14,979
|
| Voluntary
reserves |
29.1 %
|
12.8 %
|
12.7 %
|
9.3 %
|
6.5 %
|
| Monthly
income / Person |
7,988
|
6,273
|
5,852
|
4,677
|
4,853
|
| Average
household size |
3.3
|
3.3
|
3.3
|
3.3
|
3.3
|
|
|
| Gross
provincial product |
2001 |
2000 |
1999 |
1998 |
1997 |
1996 |
1995 |
1994 |
| Agriculture |
10.5 %
|
12.2 %
|
12.6 %
|
14.5 %
|
13.0 %
|
14.8 %
|
15.9 %
|
17.4 %
|
| Manufacturing |
11.2 %
|
10.9 %
|
10.3 %
|
10.9 %
|
11.4 %
|
10.5 %
|
11.8 %
|
10.5 %
|
| Construction |
2.2 %
|
2.4 %
|
2.6 %
|
1.6 %
|
3.4 %
|
7.2 %
|
4.7 %
|
5.9 %
|
| Transport
& communication |
12.0 %
|
10.4 %
|
11.1 %
|
12.3 %
|
11.7 %
|
11.8 %
|
13.1 %
|
13.0 %
|
| Wholesale
& retail trade |
7.6 %
|
11.5 %
|
12.2 %
|
11.6 %
|
13.2 %
|
12.8 %
|
12.4 %
|
11.9 %
|
| Services |
48.3 %
|
44.8 %
|
42.5 %
|
37.9 %
|
34.2 %
|
29.6 %
|
28.7 %
|
27.1 %
|
| Others |
8.2 %
|
7.8 %
|
8.7 %
|
11.2 %
|
13.1 %
|
13.3 %
|
13.4 %
|
14.2 %
|
|
|
|
|
|
|
|
|
|
| Total
(million baht) |
45,687
|
43,552
|
39,525
|
37,929
|
33,567
|
29,925
|
27,330
|
23,444
|
| GPP
per capita (baht) |
174,787
|
173,793
|
163,672
|
164,048
|
151,315
|
139,424
|
126,776
|
113,301
|
|
|
| Commercial
bank |
2003 |
2002 |
2001 |
2000 |
1999 |
1998 |
1997 |
1996 |
| No.
of offices |
41
|
41
|
37
|
40
|
31
|
31
|
31
|
31
|
| Deposits
(million baht) |
39,785
|
36,797
|
35,214
|
32,057
|
31,262
|
31,262
|
27,648
|
25,982
|
| Loans
(million baht) |
30,448
|
27,296
|
25,949
|
36,173
|
37,757
|
37,757
|
39,585
|
38,610
|
| Deposits
/ capita (baht) |
158,761
|
152,375
|
152,305
|
144,508
|
145,653
|
145,015
|
133,618
|
129,317
|
| Loans/deposits
ratio |
76.5 %
|
74.2 %
|
73.7 %
|
112.8 %
|
120.8 %
|
120.8 %
|
143.2 %
|
148.6 %
|
|
|
| Public
health |
2001 |
2000 |
1999 |
1998 |
1997 |
1996 |
1995 |
1994 |
1993 |
| No.
of hospitals |
7
|
6
|
9
|
9
|
9
|
8
|
8
|
7
|
7
|
| No.
of hospital beds |
1,010
|
825
|
699
|
693
|
903
|
730
|
557
|
485
|
505
|
| Avg.
Beds / Hospital |
144
|
137
|
77
|
77
|
100
|
91
|
69
|
69
|
72
|
| Capita
/ Hospital bed |
258
|
303
|
345
|
333
|
245
|
294
|
387
|
426
|
397
|
| No.
of physicians |
117
|
117
|
87
|
76
|
136
|
108
|
81
|
56
|
57
|
| Capita
/ Physician |
2,234
|
2,141
|
2,775
|
3,042
|
1,631
|
1,987
|
2,661
|
3,694
|
3,524
|
|
No. of dentists |
18
|
18
|
15
|
16
|
18
|
15
|
13
|
9
|
10
|
|
Capita / Dentist |
14,521
|
13,922
|
16,099
|
14,450
|
12,324
|
14,308
|
16,582
|
22,990
|
20,091
|
| No.
of nurses |
515
|
443
|
377
|
342
|
419
|
387
|
356
|
277
|
265
|
|
|
| Education |
2002 |
2000 |
1998 |
1996 |
1994 |
1993 |
| No.
of teachers |
-
|
2,274
|
2,320
|
2,161
|
2,215
|
2,218
|
| No.
of students |
-
|
49,434
|
44,802
|
42,315
|
39,894
|
34,681
|
| No.
of schools |
-
|
87
|
89
|
86
|
86
|
85
|
| No.
of classrooms |
-
|
1,351
|
1,305
|
1,305
|
1,277
|
1,124
|
| Ratio
: students / teacher |
-
|
21.7
|
19.3
|
19.6
|
18.0
|
15.6
|
| Ratio
: students / classroom |
-
|
36.6
|
34.3
|
32.4
|
31.2
|
30.9
|
|
|
| |
|

