Phatthalung is well known, in the South, as the town of the hollow hill,
located on Trang-Songkhla Highway some 840 kms. from Bangkok and 56 kms.
from Trang. Entering into the township area of Phattalung, one can see
the hollow hill located in the heart of the city as if it were the symbol
of Phattalung. Phattalung, the beautiful town with the lake originating
from Songkhla, is the province initiation two famous entertainments, i.e.,
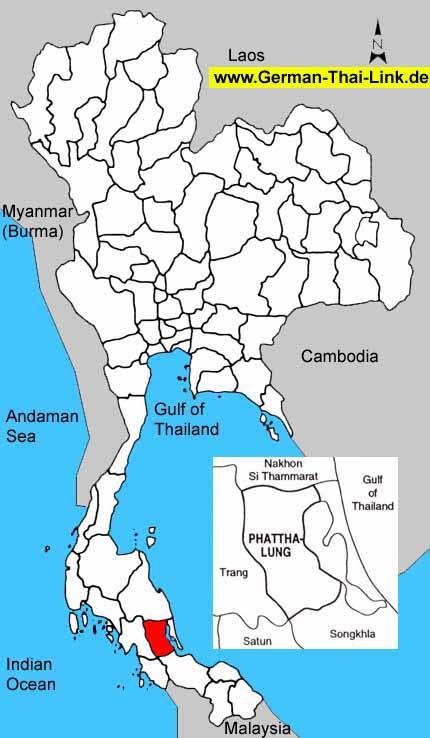
Manora and Shadows Play. It occupies an area of 3,424.5 square kilometers.
The area is of mountainous, forested with high plateau in the west sloping
down towards the east through Songkhla Lake. It borders on Nakhon Si Thammarat
and Songkhla to the north, Songkhla to the south, Songkhla Lake to the
east, Trang and Satun to the west.
Before arriving at down town area of Phattalung, one can see a hill
(Tham Khuha Sawan), top part of which is divided apart, on the left hand
side wherein the cave is located. In the cave, Buddha images are enshrined
along the wall as same as at Suwan Khuha Cave of Phangnga. However, King
Rama V and VII and paid their royal visits to the cave.
The Tham Malai cave is located in the same range of the hollow hill
having beautiful milky white stalagmite and stalactite formation including
ponds with clear and clean water inside the cave.
|
| General
Information |
| Area
sq km |
3,425
|
|
|
Anual
rainfall mm (2002) |
-
|
| Forest
Land (1999) |
431
|
12.6 %
|
Days
of rain (2002) |
-
|
| Farm
Land (1999) |
1,946
|
56.8 %
|
Mean
Temperature High/Low (2002) |
-
/
-
|
| Unclassified
Land (1999) |
1,048
|
30.6 %
|
BOI
Zone |
3
|
| Population
/ sq. km (2003) |
147
|
|
Gross
provincial product rank (2001) |
60
|
|
|
| Population |
2003 |
2002 |
2001 |
2000 |
1999 |
1998 |
1997 |
1996 |
| Male |
49.3 %
|
49.3 %
|
49.3 %
|
49.3 %
|
49.3 %
|
49.3 %
|
30.8 %
|
49.3 %
|
| Female |
50.7 %
|
50.7 %
|
50.7 %
|
50.7 %
|
50.7 %
|
50.7 %
|
69.2 %
|
50.7 %
|
| Total |
504,597
|
504,454
|
502,869
|
503,684
|
502,662
|
502,709
|
798,805
|
494,745
|
|
|
| Household
income (baht) |
2002 |
2000 |
1998 |
1996 |
1994 |
| Average
monthly income |
10,820
|
11,550
|
12,315
|
8,474
|
7,801
|
| Average
monthly expenditures |
9,865
|
9,367
|
10,190
|
8,156
|
7,161
|
| Voluntary
reserves |
8.8 %
|
18.9 %
|
17.3 %
|
3.8 %
|
8.2 %
|
| Monthly
income / Person |
3,091
|
3,300
|
3,240
|
2,230
|
1,950
|
| Average
household size |
3.5
|
3.5
|
3.8
|
3.8
|
4.0
|
|
|
| Gross
provincial product |
2001 |
2000 |
1999 |
1998 |
1997 |
1996 |
1995 |
1994 |
| Agriculture |
27.4 %
|
27.8 %
|
26.4 %
|
31.9 %
|
30.6 %
|
32.8 %
|
31.3 %
|
27.8 %
|
| Manufacturing |
3.7 %
|
3.7 %
|
3.4 %
|
3.2 %
|
3.0 %
|
2.9 %
|
3.3 %
|
3.7 %
|
| Construction |
2.0 %
|
2.5 %
|
2.6 %
|
2.6 %
|
4.8 %
|
7.9 %
|
7.1 %
|
7.6 %
|
| Transport
& communication |
4.8 %
|
4.9 %
|
5.4 %
|
5.2 %
|
5.4 %
|
5.1 %
|
5.2 %
|
5.9 %
|
| Wholesale
& retail trade |
23.3 %
|
23.4 %
|
22.6 %
|
20.8 %
|
22.7 %
|
20.5 %
|
21.9 %
|
23.8 %
|
| Services |
18.4 %
|
17.6 %
|
18.0 %
|
15.9 %
|
14.8 %
|
13.0 %
|
13.2 %
|
12.7 %
|
| Others |
20.4 %
|
20.1 %
|
21.6 %
|
20.4 %
|
18.7 %
|
17.8 %
|
18.0 %
|
18.5 %
|
|
|
|
|
|
|
|
|
|
| Total
(million baht) |
15,436
|
15,342
|
14,489
|
14,983
|
14,898
|
15,347
|
13,849
|
11,377
|
| GPP
per capita (baht) |
30,695
|
30,459
|
28,824
|
29,804
|
18,650
|
31,020
|
27,973
|
19,165
|
|
|
| Commercial
bank |
2003 |
2002 |
2001 |
2000 |
1999 |
1998 |
1997 |
1996 |
| No.
of offices |
12
|
12
|
12
|
12
|
11
|
11
|
12
|
12
|
| Deposits
(million baht) |
6,422
|
5,797
|
5,771
|
5,204
|
5,241
|
5,241
|
5,089
|
5,099
|
| Loans
(million baht) |
3,530
|
3,513
|
3,253
|
4,077
|
4,466
|
4,466
|
5,237
|
5,283
|
| Deposits
/ capita (baht) |
12,750
|
11,532
|
11,479
|
6,514
|
10,593
|
10,586
|
8,572
|
10,435
|
| Loans/deposits
ratio |
55.0 %
|
60.6 %
|
56.4 %
|
78.3 %
|
85.2 %
|
85.2 %
|
102.9 %
|
103.6 %
|
|
|
| Public
health |
2001 |
2000 |
1999 |
1998 |
1997 |
1996 |
1995 |
1994 |
1993 |
| No.
of hospitals |
11
|
12
|
12
|
12
|
12
|
12
|
12
|
10
|
9
|
| No.
of hospital beds |
722
|
729
|
717
|
717
|
637
|
609
|
582
|
503
|
473
|
| Avg.
Beds / Hospital |
65
|
60
|
59
|
59
|
53
|
50
|
48
|
50
|
52
|
| Capita
/ Hospital bed |
696
|
690
|
701
|
701
|
1,254
|
812
|
850
|
1,180
|
1,032
|
| No.
of physicians |
60
|
71
|
62
|
77
|
47
|
43
|
40
|
34
|
35
|
| Capita
/ Physician |
8,381
|
7,094
|
8,107
|
6,528
|
16,995
|
11,505
|
12,376
|
17,459
|
13,960
|
|
No. of dentists |
20
|
20
|
19
|
18
|
14
|
12
|
10
|
9
|
4
|
|
Capita / Dentist |
25,143
|
25,184
|
26,455
|
27,928
|
57,057
|
41,228
|
49,507
|
65,956
|
122,150
|
| No.
of nurses |
530
|
512
|
477
|
428
|
384
|
1,564,040
|
263
|
263
|
230
|
|
|
| Education |
2002 |
2000 |
1998 |
1996 |
1994 |
1993 |
| No.
of teachers |
-
|
5,450
|
5,651
|
5,433
|
5,508
|
5,237
|
| No.
of students |
-
|
95,376
|
97,583
|
100,335
|
103,705
|
94,910
|
| No.
of schools |
-
|
307
|
307
|
306
|
303
|
303
|
| No.
of classrooms |
-
|
3,766
|
3,754
|
3,717
|
3,740
|
3,574
|
| Ratio
: students / teacher |
-
|
17.5
|
17.3
|
18.5
|
18.8
|
18.1
|
| Ratio
: students / classroom |
-
|
25.3
|
26.0
|
27.0
|
27.7
|
26.6
|
|
|
| |
|

