|
| General
Information |
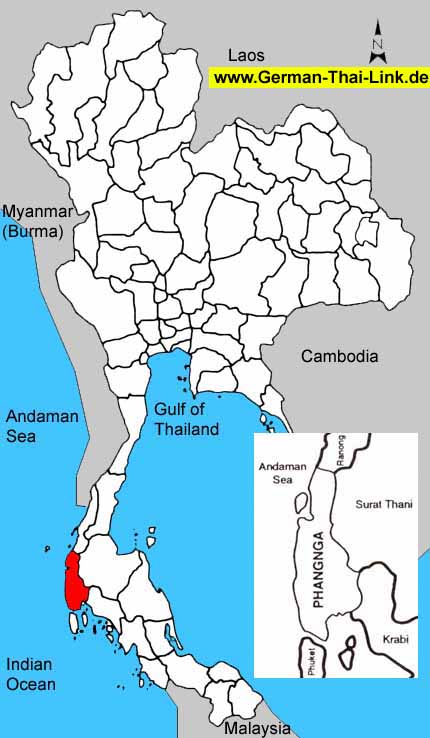
| Area
sq km |
4,171
|
|
|
Anual
rainfall mm (2002) |
3,152
|
| Forest
Land (1999) |
1,126
|
27.0 %
|
Days
of rain (2002) |
209
|
| Farm
Land (1999) |
1,351
|
32.4 %
|
Mean
Temperature High/Low (2002) |
33.5
/
23.8
|
| Unclassified
Land (1999) |
1,694
|
40.6 %
|
BOI
Zone |
3
|
| Population
/ sq. km (2003) |
57
|
|
Gross
provincial product rank (2001) |
63
|
|
|
| Population |
2003 |
2002 |
2001 |
2000 |
1999 |
1998 |
1997 |
1996 |
| Male |
50.6 %
|
50.6 %
|
50.6 %
|
50.6 %
|
50.6 %
|
50.7 %
|
50.7 %
|
50.8 %
|
| Female |
49.4 %
|
49.4 %
|
49.4 %
|
49.4 %
|
49.4 %
|
49.3 %
|
49.3 %
|
49.2 %
|
| Total |
240,725
|
239,401
|
237,514
|
235,217
|
233,179
|
231,649
|
229,704
|
227,914
|
|
|
| Household
income (baht) |
2002 |
2000 |
1998 |
1996 |
1994 |
| Average
monthly income |
12,428
|
10,217
|
7,650
|
8,696
|
6,732
|
| Average
monthly expenditures |
9,832
|
8,573
|
8,410
|
7,115
|
6,756
|
| Voluntary
reserves |
20.9 %
|
16.1 %
|
-
|
18.2 %
|
-
|
| Monthly
income / Person |
3,358
|
2,619
|
2,013
|
2,557
|
1,979
|
| Average
household size |
3.7
|
3.9
|
3.8
|
3.4
|
3.4
|
|
|
| Gross
provincial product |
2001 |
2000 |
1999 |
1998 |
1997 |
1996 |
1995 |
1994 |
| Agriculture |
52.2 %
|
55.8 %
|
58.5 %
|
65.4 %
|
63.8 %
|
61.4 %
|
63.5 %
|
61.3 %
|
| Manufacturing |
4.8 %
|
4.5 %
|
4.0 %
|
3.2 %
|
3.0 %
|
3.2 %
|
3.0 %
|
3.5 %
|
| Construction |
2.2 %
|
1.7 %
|
1.6 %
|
1.1 %
|
2.8 %
|
3.6 %
|
3.3 %
|
3.0 %
|
| Transport
& communication |
3.7 %
|
2.7 %
|
3.0 %
|
3.0 %
|
2.7 %
|
3.4 %
|
2.7 %
|
2.3 %
|
| Wholesale
& retail trade |
12.5 %
|
12.2 %
|
10.5 %
|
8.2 %
|
9.3 %
|
9.4 %
|
9.3 %
|
10.1 %
|
| Services |
9.6 %
|
9.1 %
|
9.3 %
|
6.9 %
|
7.2 %
|
9.4 %
|
9.3 %
|
10.1 %
|
| Others |
15.0 %
|
14.0 %
|
13.1 %
|
12.2 %
|
11.2 %
|
9.6 %
|
8.9 %
|
9.7 %
|
|
|
|
|
|
|
|
|
|
| Total
(million baht) |
14,055
|
14,673
|
14,046
|
17,535
|
17,115
|
16,066
|
15,769
|
12,884
|
| GPP
per capita (baht) |
59,175
|
62,380
|
60,236
|
75,696
|
74,508
|
70,491
|
69,530
|
57,413
|
|
|
| Commercial
bank |
2003 |
2002 |
2001 |
2000 |
1999 |
1998 |
1997 |
1996 |
| No.
of offices |
20
|
19
|
20
|
21
|
21
|
21
|
20
|
20
|
| Deposits
(million baht) |
7,373
|
6,807
|
6,875
|
6,795
|
7,145
|
7,145
|
6,929
|
6,683
|
| Loans
(million baht) |
5,422
|
3,999
|
3,611
|
4,418
|
4,852
|
4,852
|
5,441
|
5,913
|
| Deposits
/ capita (baht) |
31,345
|
29,192
|
29,678
|
29,581
|
31,349
|
31,504
|
30,876
|
30,105
|
| Loans/deposits
ratio |
73.5 %
|
58.7 %
|
52.5 %
|
65.0 %
|
67.9 %
|
67.9 %
|
78.5 %
|
88.5 %
|
|
|
| Public
health |
2001 |
2000 |
1999 |
1998 |
1997 |
1996 |
1995 |
1994 |
1993 |
| No.
of hospitals |
9
|
9
|
11
|
10
|
11
|
10
|
9
|
9
|
9
|
| No.
of hospital beds |
564
|
567
|
582
|
572
|
577
|
496
|
416
|
416
|
396
|
| Avg.
Beds / Hospital |
62
|
63
|
52
|
57
|
52
|
49
|
46
|
46
|
44
|
| Capita
/ Hospital bed |
421
|
414
|
400
|
404
|
398
|
459
|
545
|
539
|
560
|
| No.
of physicians |
55
|
55
|
59
|
49
|
45
|
45
|
45
|
43
|
42
|
| Capita
/ Physician |
4,318
|
4,276
|
3,952
|
4,727
|
5,104
|
5,064
|
5,039
|
5,218
|
5,285
|
|
No. of dentists |
20
|
17
|
16
|
19
|
14
|
12
|
11
|
11
|
9
|
|
Capita / Dentist |
11,875
|
13,836
|
14,573
|
12,192
|
16,407
|
18,992
|
20,617
|
20,400
|
24,665
|
| No.
of nurses |
448
|
391
|
402
|
379
|
347
|
331
|
316
|
319
|
277
|
|
|
| Education |
2002 |
2000 |
1998 |
1996 |
1994 |
1993 |
| No.
of teachers |
-
|
2,596
|
2,638
|
2,566
|
2,623
|
2,548
|
| No.
of students |
-
|
48,529
|
48,427
|
47,375
|
47,129
|
44,594
|
| No.
of schools |
-
|
198
|
199
|
201
|
200
|
201
|
| No.
of classrooms |
-
|
2,104
|
2,125
|
2,114
|
2,003
|
1,941
|
| Ratio
: students / teacher |
-
|
18.7
|
18.4
|
18.5
|
18.0
|
17.5
|
| Ratio
: students / classroom |
-
|
23.1
|
22.8
|
22.4
|
23.5
|
23.0
|
|
|
| |
|

