|
| General
Information |
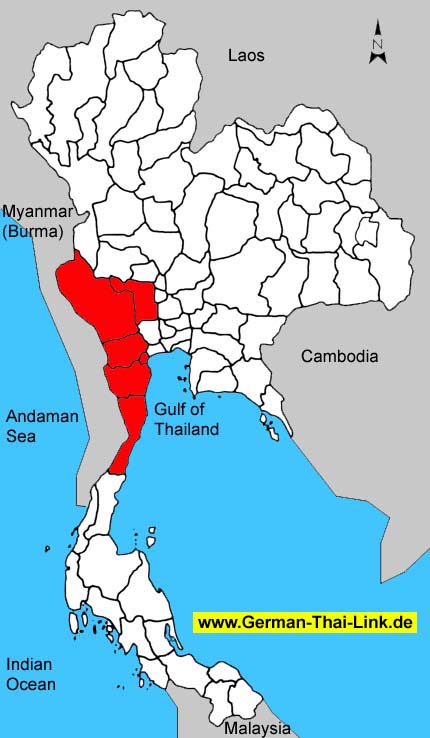
| Area
sq km |
42,630
|
|
|
Anual
rainfall mm (2002) |
1,019
|
| Forest
Land (1999) |
15,705
|
36.8 %
|
Days
of rain (2002) |
114
|
| Farm
Land (1999) |
11,277
|
26.5 %
|
Mean
Temperature High/Low (2002) |
33.3
/
24.4
|
| Unclassified
Land (1999) |
15,648
|
36.7 %
|
BOI
Zone |
-
|
| Population
/ sq. km (2003) |
81
|
|
Gross
provincial product rank (2001) |
-
|
|
|
| Population |
2003 |
2002 |
2001 |
2000 |
1999 |
1998 |
1997 |
1996 |
| Male |
49.5 %
|
49.6 %
|
49.6 %
|
49.6 %
|
49.7 %
|
49.7 %
|
49.7 %
|
49.8 %
|
| Female |
50.5 %
|
50.4 %
|
50.4 %
|
50.4 %
|
50.3 %
|
50.3 %
|
50.3 %
|
50.2 %
|
| Total |
3,453,972
|
3,445,231
|
3,419,232
|
3,401,642
|
3,385,495
|
3,383,170
|
3,355,229
|
3,324,740
|
|
|
| Household
income (baht) |
2002 |
2000 |
1998 |
1996 |
1994 |
| Average
monthly income |
14,115
|
12,916
|
12,558
|
10,198
|
7,962
|
| Average
monthly expenditures |
10,440
|
8,913
|
9,906
|
8,784
|
7,287
|
| Voluntary
reserves |
26.0 %
|
31.0 %
|
21.1 %
|
13.9 %
|
8.5 %
|
| Monthly
income / Person |
4,032
|
3,587
|
3,394
|
2,756
|
2,151
|
| Average
household size |
3.5
|
3.6
|
3.7
|
3.7
|
3.7
|
|
|
| Gross
provincial product |
2001 |
2000 |
1999 |
1998 |
1997 |
1996 |
1995 |
1994 |
| Agriculture |
18.2 %
|
17.6 %
|
18.8 %
|
21.7 %
|
19.6 %
|
18.9 %
|
15.9 %
|
15.4 %
|
| Manufacturing |
25.0 %
|
25.8 %
|
25.0 %
|
24.4 %
|
22.8 %
|
21.1 %
|
21.6 %
|
21.0 %
|
| Construction |
3.3 %
|
3.6 %
|
4.3 %
|
4.0 %
|
6.1 %
|
8.4 %
|
8.7 %
|
9.2 %
|
| Transport
& communication |
5.2 %
|
5.5 %
|
5.6 %
|
5.4 %
|
6.0 %
|
8.9 %
|
6.8 %
|
7.1 %
|
| Wholesale
& retail trade |
15.5 %
|
17.0 %
|
17.0 %
|
16.2 %
|
17.6 %
|
17.5 %
|
18.0 %
|
18.5 %
|
| Services |
11.7 %
|
12.0 %
|
11.9 %
|
10.7 %
|
10.2 %
|
10.4 %
|
10.5 %
|
10.1 %
|
| Others |
21.1 %
|
18.5 %
|
17.4 %
|
17.6 %
|
17.7 %
|
14.8 %
|
18.5 %
|
18.7 %
|
|
|
|
|
|
|
|
|
|
| Total
(million baht) |
214,203
|
197,300
|
188,262
|
189,050
|
187,777
|
176,600
|
164,450
|
140,805
|
| GPP
per capita (baht) |
62,646
|
58,001
|
55,608
|
55,879
|
55,965
|
53,116
|
49,747
|
42,866
|
|
|
| Commercial
bank |
2003 |
2002 |
2001 |
2000 |
1999 |
1998 |
1997 |
1996 |
| No.
of offices |
188
|
191
|
198
|
212
|
189
|
185
|
196
|
186
|
| Deposits
(million baht) |
118,244
|
116,395
|
119,214
|
111,868
|
115,652
|
118,775
|
116,772
|
112,192
|
| Loans
(million baht) |
70,295
|
63,794
|
59,669
|
74,493
|
81,518
|
83,754
|
93,775
|
92,214
|
| Deposits
/ capita (baht) |
34,760
|
34,380
|
35,237
|
33,341
|
34,785
|
35,930
|
35,549
|
34,387
|
| Loans/deposits
ratio |
59.4 %
|
54.8 %
|
50.1 %
|
66.6 %
|
70.5 %
|
70.5 %
|
80.3 %
|
82.2 %
|
|
|
| Public
health |
2001 |
2000 |
1999 |
1998 |
1997 |
1996 |
1995 |
1994 |
1993 |
| No.
of hospitals |
88
|
88
|
98
|
97
|
101
|
96
|
93
|
90
|
80
|
| No.
of hospital beds |
7,698
|
7,780
|
7,660
|
7,491
|
7,191
|
16,536
|
25,883
|
5,467
|
5,233
|
| Avg.
Beds / Hospital |
87
|
88
|
78
|
77
|
71
|
172
|
278
|
60
|
65
|
| Capita
/ Hospital bed |
444
|
437
|
441
|
451
|
466
|
201
|
127
|
600
|
623
|
| No.
of physicians |
778
|
781
|
720
|
742
|
580
|
563
|
549
|
501
|
494
|
| Capita
/ Physician |
4,394
|
4,355
|
4,702
|
4,559
|
5,784
|
5,905
|
6,021
|
6,556
|
6,604
|
|
No. of dentists |
162
|
158
|
139
|
161
|
119
|
122
|
127
|
121
|
107
|
|
Capita / Dentist |
21,106
|
21,529
|
24,356
|
21,013
|
28,195
|
27,251
|
26,029
|
27,146
|
30,491
|
| No.
of nurses |
4,026
|
3,803
|
3,669
|
3,383
|
2,837
|
2,893
|
2,953
|
2,791
|
2,496
|
|
|
| Education |
2002 |
2000 |
1998 |
1996 |
1994 |
1993 |
| No.
of teachers |
-
|
32,210
|
32,394
|
31,093
|
31,587
|
30,860
|
| No.
of students |
-
|
633,887
|
624,296
|
600,217
|
587,866
|
556,327
|
| No.
of schools |
-
|
2,091
|
2,119
|
2,417
|
2,089
|
2,092
|
| No.
of classrooms |
-
|
23,858
|
55,248
|
23,519
|
23,364
|
22,144
|
| Ratio
: students / teacher |
-
|
19.7
|
19.3
|
19.3
|
18.6
|
18.0
|
| Ratio
: students / classroom |
-
|
26.6
|
11.3
|
25.5
|
25.2
|
25.1
|
|
|
| |
|

