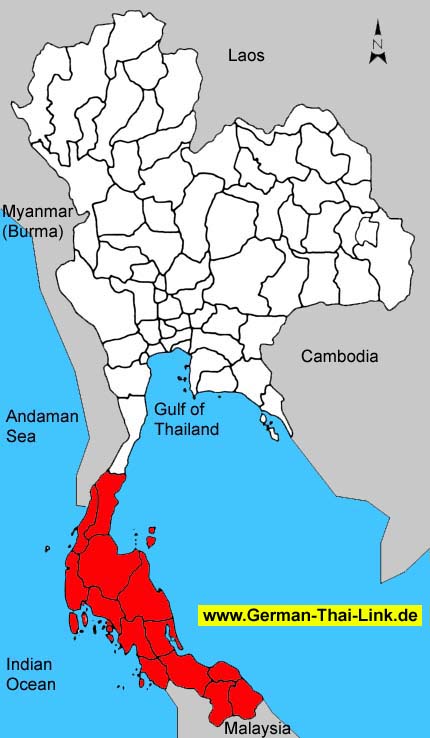
|
| General
Information |
| Area
sq km |
70,716
|
|
|
Anual
rainfall mm (2002) |
2,148
|
| Forest
Land (1999) |
11,994
|
17.0 %
|
Days
of rain (2002) |
163
|
| Farm
Land (1999) |
30,623
|
43.3 %
|
Mean
Temperature High/Low (2002) |
32.7
/
23.9
|
| Unclassified
Land (1999) |
28,099
|
39.7 %
|
BOI
Zone |
-
|
| Population
/ sq. km (2003) |
120
|
|
Gross
provincial product rank (2001) |
-
|
|
|
| Population |
2003 |
2002 |
2001 |
2000 |
1999 |
1998 |
1997 |
1996 |
| Male |
49.7 %
|
49.7 %
|
49.7 %
|
49.8 %
|
49.8 %
|
49.9 %
|
48.1 %
|
46.4 %
|
| Female |
50.3 %
|
50.3 %
|
50.3 %
|
50.2 %
|
50.2 %
|
50.1 %
|
51.9 %
|
53.6 %
|
| Total |
8,499,848
|
8,415,908
|
8,311,567
|
8,217,646
|
8,152,638
|
8,066,779
|
8,244,865
|
7,808,073
|
|
|
| Household
income (baht) |
2002 |
2000 |
1998 |
1996 |
1994 |
| Average
monthly income |
12,698
|
11,333
|
11,602
|
9,354
|
8,026
|
| Average
monthly expenditures |
10,811
|
9,413
|
9,791
|
8,799
|
7,542
|
| Voluntary
reserves |
14.9 %
|
16.9 %
|
15.6 %
|
5.9 %
|
6.0 %
|
| Monthly
income / Person |
3,431
|
2,982
|
2,974
|
2,398
|
2,006
|
| Average
household size |
3.7
|
3.8
|
3.9
|
3.9
|
4.0
|
|
|
| Gross
provincial product |
2001 |
2000 |
1999 |
1998 |
1997 |
1996 |
1995 |
1994 |
| Agriculture |
33.8 %
|
35.2 %
|
35.2 %
|
41.1 %
|
38.2 %
|
37.7 %
|
39.7 %
|
38.2 %
|
| Manufacturing |
7.6 %
|
7.4 %
|
7.1 %
|
6.3 %
|
6.4 %
|
6.4 %
|
6.1 %
|
6.3 %
|
| Construction |
3.2 %
|
3.6 %
|
4.0 %
|
2.9 %
|
4.8 %
|
7.4 %
|
6.7 %
|
6.6 %
|
| Transport
& communication |
5.4 %
|
5.0 %
|
5.3 %
|
5.1 %
|
6.4 %
|
5.4 %
|
5.3 %
|
5.4 %
|
| Wholesale
& retail trade |
13.2 %
|
13.8 %
|
13.9 %
|
12.2 %
|
13.1 %
|
13.5 %
|
13.7 %
|
14.8 %
|
| Services |
19.2 %
|
18.1 %
|
17.6 %
|
14.6 %
|
14.3 %
|
13.3 %
|
12.9 %
|
12.8 %
|
| Others |
17.6 %
|
16.9 %
|
16.9 %
|
17.8 %
|
16.8 %
|
16.3 %
|
15.6 %
|
15.9 %
|
|
|
|
|
|
|
|
|
|
| Total
(million baht) |
456,231
|
449,389
|
422,828
|
458,424
|
426,697
|
411,248
|
386,690
|
330,504
|
| GPP
per capita (baht) |
54,891
|
54,685
|
51,863
|
56,828
|
51,753
|
52,669
|
49,427
|
42,294
|
|
|
| Commercial
bank |
2003 |
2002 |
2001 |
2000 |
1999 |
1998 |
1997 |
1996 |
| No.
of offices |
415
|
414
|
410
|
420
|
370
|
370
|
387
|
372
|
| Deposits
(million baht) |
277,707
|
263,632
|
259,229
|
232,644
|
230,522
|
230,522
|
216,177
|
203,221
|
| Loans
(million baht) |
173,993
|
159,769
|
149,118
|
197,429
|
209,263
|
209,257
|
234,442
|
236,775
|
| Deposits
/ capita (baht) |
33,793
|
32,337
|
32,135
|
28,216
|
29,523
|
29,465
|
27,664
|
26,778
|
| Loans/deposits
ratio |
62.7 %
|
60.6 %
|
57.5 %
|
84.9 %
|
90.8 %
|
90.8 %
|
108.4 %
|
116.5 %
|
|
|
| Public
health |
2001 |
2000 |
1999 |
1998 |
1997 |
1996 |
1995 |
1994 |
1993 |
| No.
of hospitals |
197
|
200
|
207
|
204
|
201
|
190
|
187
|
178
|
163
|
| No.
of hospital beds |
16,814
|
16,553
|
15,944
|
15,799
|
16,016
|
15,821
|
15,634
|
14,668
|
11,178
|
| Avg.
Beds / Hospital |
85
|
82
|
77
|
77
|
79
|
83
|
83
|
82
|
68
|
| Capita
/ Hospital bed |
494
|
496
|
511
|
510
|
514
|
493
|
500
|
532
|
678
|
| No.
of physicians |
1,612
|
1,576
|
1,659
|
1,663
|
1,510
|
1,435
|
1,369
|
1,284
|
1,274
|
| Capita
/ Physician |
5,156
|
5,214
|
4,914
|
4,850
|
5,460
|
5,441
|
5,714
|
6,085
|
5,956
|
|
No. of dentists |
414
|
363
|
316
|
297
|
248
|
269
|
298
|
286
|
246
|
|
Capita / Dentist |
20,076
|
22,638
|
25,799
|
27,160
|
33,245
|
29,026
|
26,252
|
27,322
|
30,849
|
| No.
of nurses |
10,250
|
9,264
|
8,332
|
7,720
|
7,290
|
1,570,587
|
6,460
|
5,917
|
5,694
|
|
|
| Education |
2002 |
2000 |
1998 |
1996 |
1994 |
1993 |
| No.
of teachers |
-
|
83,557
|
83,368
|
80,209
|
79,977
|
77,396
|
| No.
of students |
-
|
1,686,096
|
1,680,587
|
1,644,244
|
1,597,708
|
1,490,116
|
| No.
of schools |
-
|
5,193
|
5,259
|
5,300
|
5,249
|
5,267
|
| No.
of classrooms |
-
|
60,121
|
60,552
|
60,082
|
57,759
|
56,333
|
| Ratio
: students / teacher |
-
|
20.2
|
20.2
|
20.5
|
20.0
|
19.3
|
| Ratio
: students / classroom |
-
|
28.0
|
27.8
|
27.4
|
27.7
|
26.5
|
|
|
| |
|


