 |
| General
Information |
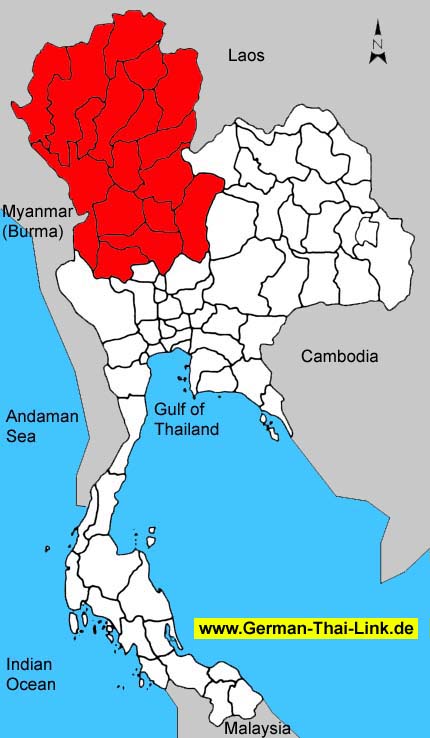
| Area
sq km |
169,645
|
|
|
Anual
rainfall mm (2002) |
1,404
|
| Forest
Land (1999) |
72,631
|
42.8 %
|
Days
of rain (2002) |
129
|
| Farm
Land (1999) |
45,300
|
26.7 %
|
Mean
Temperature High/Low (2002) |
33.0
/
21.9
|
| Unclassified
Land (1999) |
51,714
|
30.5 %
|
BOI
Zone |
-
|
| Population
/ sq. km (2003) |
71
|
|
Gross
provincial product rank (2001) |
-
|
|
|
| Population |
2003 |
2002 |
2001 |
2000 |
1999 |
1998 |
1997 |
1996 |
| Male |
49.6 %
|
48.8 %
|
49.7 %
|
49.7 %
|
48.9 %
|
49.8 %
|
49.9 %
|
49.9 %
|
| Female |
50.4 %
|
51.2 %
|
50.3 %
|
50.3 %
|
51.1 %
|
50.2 %
|
50.1 %
|
50.1 %
|
| Total |
12,088,671
|
12,152,502
|
12,124,425
|
12,101,196
|
12,124,939
|
12,159,930
|
12,091,337
|
11,986,299
|
|
|
| Household
income (baht) |
2002 |
2000 |
1998 |
1996 |
1994 |
| Average
monthly income |
9,503
|
8,653
|
9,763
|
8,327
|
6,217
|
| Average
monthly expenditures |
7,740
|
7,313
|
8,200
|
7,039
|
5,868
|
| Voluntary
reserves |
18.6 %
|
15.5 %
|
16.0 %
|
15.5 %
|
5.6 %
|
| Monthly
income / Person |
2,969
|
2,544
|
2,789
|
2,449
|
1,776
|
| Average
household size |
3.2
|
3.4
|
3.5
|
3.4
|
3.5
|
|
|
| Gross
provincial product |
2001 |
2000 |
1999 |
1998 |
1997 |
1996 |
1995 |
1994 |
| Agriculture |
20.1 %
|
19.3 %
|
20.6 %
|
24.6 %
|
21.5 %
|
20.9 %
|
18.1 %
|
18.8 %
|
| Manufacturing |
13.9 %
|
13.8 %
|
13.2 %
|
12.1 %
|
11.9 %
|
11.8 %
|
12.2 %
|
12.3 %
|
| Construction |
3.5 %
|
4.6 %
|
5.1 %
|
4.5 %
|
7.9 %
|
10.2 %
|
10.5 %
|
10.0 %
|
| Transport
& communication |
4.9 %
|
4.8 %
|
4.7 %
|
4.8 %
|
5.3 %
|
5.0 %
|
5.2 %
|
5.3 %
|
| Wholesale
& retail trade |
15.0 %
|
15.2 %
|
16.1 %
|
15.2 %
|
16.8 %
|
16.0 %
|
17.1 %
|
17.1 %
|
| Services |
19.4 %
|
18.6 %
|
18.1 %
|
16.0 %
|
15.1 %
|
14.8 %
|
15.0 %
|
14.5 %
|
| Others |
23.2 %
|
23.7 %
|
22.2 %
|
22.8 %
|
21.5 %
|
21.3 %
|
21.9 %
|
22.0 %
|
|
|
|
|
|
|
|
|
|
| Total
(million baht) |
454,400
|
443,574
|
431,141
|
440,243
|
433,372
|
422,298
|
379,381
|
335,992
|
| GPP
per capita (baht) |
37,478
|
36,655
|
35,558
|
36,204
|
35,841
|
35,231
|
31,519
|
28,216
|
|
|
| Commercial
bank |
2003 |
2002 |
2001 |
2000 |
1999 |
1998 |
1997 |
1996 |
| No.
of offices |
473
|
477
|
496
|
524
|
461
|
461
|
497
|
478
|
| Deposits
(million baht) |
280,728
|
276,232
|
284,115
|
255,523
|
264,132
|
260,074
|
186,394
|
170,573
|
| Loans
(million baht) |
197,266
|
181,507
|
164,029
|
199,989
|
219,832
|
226,325
|
249,434
|
238,957
|
| Deposits
/ capita (baht) |
23,198
|
22,782
|
23,364
|
21,132
|
22,036
|
21,607
|
15,653
|
14,362
|
| Loans/deposits
ratio |
70.3 %
|
65.7 %
|
57.7 %
|
78.3 %
|
83.2 %
|
87.0 %
|
133.8 %
|
140.1 %
|
|
|
| Public
health |
2001 |
2000 |
1999 |
1998 |
1997 |
1996 |
1995 |
1994 |
1993 |
| No.
of hospitals |
268
|
254
|
260
|
261
|
266
|
249
|
242
|
232
|
205
|
| No.
of hospital beds |
30,406
|
24,579
|
25,426
|
25,519
|
25,874
|
22,548
|
19,224
|
17,349
|
15,963
|
| Avg.
Beds / Hospital |
113
|
96
|
97
|
97
|
97
|
90
|
79
|
74
|
77
|
| Capita
/ Hospital bed |
398
|
492
|
476
|
476
|
467
|
531
|
626
|
686
|
744
|
| No.
of physicians |
2,699
|
2,691
|
2,494
|
2,401
|
2,079
|
2,060
|
2,047
|
1,943
|
1,823
|
| Capita
/ Physician |
4,492
|
4,496
|
4,861
|
5,064
|
5,815
|
5,818
|
5,879
|
6,128
|
6,514
|
|
No. of dentists |
577
|
711
|
446
|
444
|
398
|
369
|
348
|
336
|
295
|
|
Capita / Dentist |
21,012
|
17,019
|
27,185
|
27,387
|
30,380
|
32,483
|
34,587
|
35,439
|
40,259
|
| No.
of nurses |
14,146
|
13,341
|
11,882
|
11,026
|
10,130
|
9,692
|
9,263
|
8,704
|
7,823
|
|
|
| Education |
2002 |
2000 |
1998 |
1996 |
1994 |
1993 |
| No.
of teachers |
-
|
112,566
|
114,022
|
109,805
|
108,852
|
106,617
|
| No.
of students |
-
|
2,092,045
|
2,085,502
|
2,047,108
|
1,982,114
|
1,878,627
|
| No.
of schools |
-
|
8,627
|
8,774
|
8,808
|
8,742
|
8,842
|
| No.
of classrooms |
-
|
88,555
|
88,903
|
88,337
|
83,835
|
82,186
|
| Ratio
: students / teacher |
-
|
18.6
|
18.3
|
18.6
|
18.2
|
17.6
|
| Ratio
: students / classroom |
-
|
23.6
|
23.5
|
23.2
|
23.6
|
22.9
|
|
|
| |
|

