 |
| General
Information |
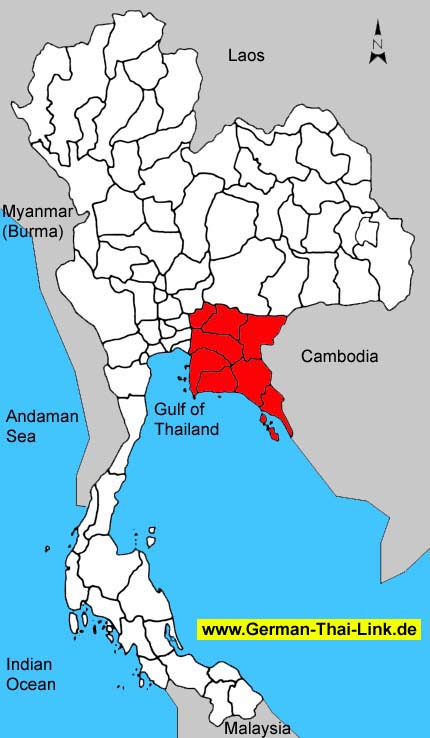
| Area
sq km |
36,502
|
|
|
Anual
rainfall mm (2002) |
2,060
|
| Forest
Land (1999) |
7,482
|
20.5 %
|
Days
of rain (2002) |
145
|
| Farm
Land (1999) |
16,829
|
46.1 %
|
Mean
Temperature High/Low (2002) |
33.4
/
24.5
|
| Unclassified
Land (1999) |
12,191
|
33.4 %
|
BOI
Zone |
-
|
| Population
/ sq. km (2003) |
119
|
|
Gross
provincial product rank (2001) |
-
|
|
|
| Population |
2003 |
2002 |
2001 |
2000 |
1999 |
1998 |
1997 |
1996 |
| Male |
49.9 %
|
50.0 %
|
50.0 %
|
50.1 %
|
50.1 %
|
50.4 %
|
50.6 %
|
50.4 %
|
| Female |
50.1 %
|
50.0 %
|
50.0 %
|
49.9 %
|
49.9 %
|
49.6 %
|
49.4 %
|
49.6 %
|
| Total |
4,350,206
|
4,300,513
|
4,241,974
|
4,180,837
|
4,141,049
|
4,122,037
|
4,064,873
|
4,000,799
|
|
|
| Household
income (baht) |
2002 |
2000 |
1998 |
1996 |
1994 |
| Average
monthly income |
14,206
|
12,296
|
12,459
|
11,030
|
8,675
|
| Average
monthly expenditures |
11,504
|
10,686
|
11,205
|
9,974
|
7,937
|
| Voluntary
reserves |
19.0 %
|
13.1 %
|
10.1 %
|
9.6 %
|
8.5 %
|
| Monthly
income / Person |
4,058
|
3,616
|
3,460
|
3,063
|
2,344
|
| Average
household size |
3.5
|
3.4
|
3.6
|
3.6
|
3.7
|
|
|
| Gross
provincial product |
2001 |
2000 |
1999 |
1998 |
1997 |
1996 |
1995 |
1994 |
| Agriculture |
7.4 %
|
6.8 %
|
8.4 %
|
10.8 %
|
9.4 %
|
9.9 %
|
11.2 %
|
11.6 %
|
| Manufacturing |
48.8 %
|
50.4 %
|
49.2 %
|
46.1 %
|
42.9 %
|
45.5 %
|
43.9 %
|
42.7 %
|
| Construction |
2.3 %
|
2.0 %
|
2.2 %
|
2.1 %
|
3.7 %
|
4.8 %
|
5.2 %
|
6.0 %
|
| Transport
& communication |
5.5 %
|
4.7 %
|
5.1 %
|
4.2 %
|
5.2 %
|
4.6 %
|
4.4 %
|
4.1 %
|
| Wholesale
& retail trade |
6.9 %
|
8.2 %
|
8.8 %
|
8.8 %
|
10.2 %
|
9.7 %
|
10.3 %
|
10.2 %
|
| Services |
7.1 %
|
7.1 %
|
7.5 %
|
7.5 %
|
7.7 %
|
8.2 %
|
8.1 %
|
8.3 %
|
| Others |
22.0 %
|
20.8 %
|
18.8 %
|
20.5 %
|
20.9 %
|
17.3 %
|
16.9 %
|
17.1 %
|
|
|
|
|
|
|
|
|
|
| Total
(million baht) |
706,250
|
668,025
|
590,852
|
533,281
|
501,487
|
463,457
|
399,471
|
340,988
|
| GPP
per capita (baht) |
166,490
|
159,782
|
142,681
|
129,373
|
123,370
|
115,841
|
100,560
|
87,281
|
|
|
| Commercial
bank |
2003 |
2002 |
2001 |
2000 |
1999 |
1998 |
1997 |
1996 |
| No.
of offices |
322
|
317
|
326
|
355
|
312
|
312
|
311
|
305
|
| Deposits
(million baht) |
247,283
|
238,241
|
237,401
|
220,284
|
228,989
|
228,989
|
219,792
|
205,854
|
| Loans
(million baht) |
145,487
|
137,554
|
126,889
|
146,497
|
160,100
|
155,599
|
169,569
|
170,006
|
| Deposits
/ capita (baht) |
59,146
|
57,531
|
57,593
|
54,192
|
57,235
|
57,644
|
56,259
|
53,491
|
| Loans/deposits
ratio |
58.8 %
|
57.7 %
|
53.4 %
|
66.5 %
|
69.9 %
|
68.0 %
|
77.1 %
|
82.6 %
|
|
|
| Public
health |
2001 |
2000 |
1999 |
1998 |
1997 |
1996 |
1995 |
1994 |
1993 |
| No.
of hospitals |
103
|
103
|
106
|
104
|
113
|
106
|
103
|
96
|
91
|
| No.
of hospital beds |
10,286
|
10,097
|
9,735
|
9,615
|
9,880
|
9,271
|
8,664
|
7,379
|
7,047
|
| Avg.
Beds / Hospital |
99
|
98
|
91
|
92
|
87
|
87
|
84
|
76
|
77
|
| Capita
/ Hospital bed |
412
|
414
|
425
|
428
|
411
|
431
|
458
|
529
|
546
|
| No.
of physicians |
1,330
|
1,349
|
1,111
|
1,025
|
944
|
932
|
925
|
836
|
796
|
| Capita
/ Physician |
3,189
|
3,099
|
3,727
|
4,021
|
4,306
|
4,292
|
4,294
|
4,673
|
4,834
|
|
No. of dentists |
264
|
245
|
246
|
256
|
208
|
201
|
197
|
174
|
166
|
|
Capita / Dentist |
16,068
|
17,064
|
16,833
|
16,101
|
19,542
|
19,904
|
20,164
|
22,452
|
23,182
|
| No.
of nurses |
6,213
|
5,567
|
4,976
|
4,568
|
4,201
|
3,853
|
3,509
|
3,552
|
3,300
|
|
|
| Education |
2002 |
2000 |
1998 |
1996 |
1994 |
1993 |
| No.
of teachers |
-
|
39,291
|
38,853
|
37,386
|
36,369
|
35,611
|
| No.
of students |
-
|
827,484
|
795,985
|
764,690
|
730,425
|
703,650
|
| No.
of schools |
-
|
2,396
|
2,434
|
2,441
|
2,423
|
2,413
|
| No.
of classrooms |
-
|
28,459
|
28,511
|
28,258
|
27,811
|
26,206
|
| Ratio
: students / teacher |
-
|
21.1
|
20.5
|
20.5
|
20.1
|
19.8
|
| Ratio
: students / classroom |
-
|
29.1
|
27.9
|
27.1
|
26.3
|
26.9
|
|
|
| |
|

