|
| General
Information |
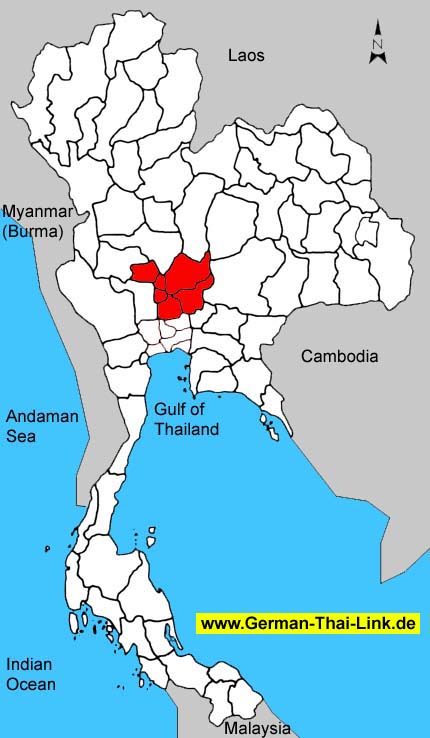
| Area
sq km |
16,595
|
|
|
Anual
rainfall mm (2002) |
1,091
|
| Forest
Land (1999) |
239
|
1.4 %
|
Days
of rain (2002) |
108
|
| Farm
Land (1999) |
10,095
|
60.8 %
|
Mean
Temperature High/Low (2002) |
33.8
/
24.6
|
| Unclassified
Land (1999) |
6,261
|
37.7 %
|
BOI
Zone |
-
|
| Population
/ sq. km (2003) |
181
|
|
Gross
provincial product rank (2001) |
-
|
|
|
| Population |
2003 |
2002 |
2001 |
2000 |
1999 |
1998 |
1997 |
1996 |
| Male |
49.4 %
|
49.4 %
|
49.4 %
|
49.4 %
|
49.5 %
|
49.6 %
|
49.5 %
|
49.5 %
|
| Female |
50.6 %
|
50.6 %
|
50.6 %
|
50.6 %
|
50.5 %
|
50.4 %
|
50.5 %
|
50.5 %
|
| Total |
3,008,118
|
3,002,544
|
2,984,711
|
2,967,201
|
2,963,535
|
2,952,647
|
2,941,526
|
2,906,539
|
|
|
| Household
income (baht) |
2002 |
2000 |
1998 |
1996 |
1994 |
| Average
monthly income |
12,662
|
12,575
|
11,764
|
10,347
|
9,065
|
| Average
monthly expenditures |
10,194
|
10,087
|
10,342
|
8,646
|
7,464
|
| Voluntary
reserves |
19.5 %
|
19.8 %
|
12.1 %
|
16.4 %
|
17.7 %
|
| Monthly
income / Person |
3,836
|
3,698
|
3,267
|
2,956
|
2,590
|
| Average
household size |
3.3
|
3.4
|
3.6
|
3.5
|
3.5
|
|
|
| Gross
provincial product |
2001 |
2000 |
1999 |
1998 |
1997 |
1996 |
1995 |
1994 |
| Agriculture |
10.6 %
|
10.1 %
|
10.6 %
|
13.9 %
|
11.2 %
|
11.1 %
|
10.4 %
|
9.3 %
|
| Manufacturing |
41.8 %
|
40.8 %
|
39.7 %
|
36.3 %
|
36.1 %
|
36.9 %
|
38.1 %
|
38.6 %
|
| Construction |
3.0 %
|
3.4 %
|
4.1 %
|
4.4 %
|
7.7 %
|
7.9 %
|
6.2 %
|
5.5 %
|
| Transport
& communication |
4.6 %
|
4.5 %
|
4.8 %
|
4.6 %
|
4.7 %
|
4.3 %
|
4.3 %
|
4.4 %
|
| Wholesale
& retail trade |
12.6 %
|
13.5 %
|
12.7 %
|
12.8 %
|
13.0 %
|
12.4 %
|
13.4 %
|
13.8 %
|
| Services |
10.8 %
|
10.4 %
|
10.1 %
|
8.9 %
|
8.0 %
|
9.2 %
|
7.7 %
|
7.6 %
|
| Others |
16.6 %
|
17.3 %
|
18.0 %
|
19.1 %
|
19.3 %
|
18.2 %
|
19.9 %
|
20.8 %
|
|
|
|
|
|
|
|
|
|
| Total
(million baht) |
229,554
|
219,646
|
207,814
|
208,481
|
220,634
|
212,350
|
187,745
|
161,719
|
| GPP
per capita (baht) |
76,909
|
74,024
|
70,123
|
70,608
|
75,006
|
73,059
|
64,702
|
56,067
|
|
|
| Commercial
bank |
2003 |
2002 |
2001 |
2000 |
1999 |
1998 |
1997 |
1996 |
| No.
of offices |
186
|
184
|
190
|
201
|
177
|
177
|
179
|
170
|
| Deposits
(million baht) |
112,350
|
108,631
|
109,578
|
102,291
|
111,082
|
111,082
|
106,310
|
99,805
|
| Loans
(million baht) |
66,103
|
60,554
|
52,335
|
64,417
|
69,170
|
69,150
|
74,564
|
79,846
|
| Deposits
/ capita (baht) |
37,863
|
36,655
|
37,111
|
34,774
|
38,217
|
38,282
|
36,857
|
34,720
|
| Loans/deposits
ratio |
58.8 %
|
55.7 %
|
47.8 %
|
63.0 %
|
62.3 %
|
62.3 %
|
70.1 %
|
80.0 %
|
|
|
| Public
health |
2001 |
2000 |
1999 |
1998 |
1997 |
1996 |
1995 |
1994 |
1993 |
| No.
of hospitals |
84
|
84
|
81
|
82
|
76
|
77
|
83
|
79
|
68
|
| No.
of hospital beds |
7,241
|
7,111
|
7,053
|
7,160
|
6,592
|
6,513
|
6,437
|
5,800
|
5,551
|
| Avg.
Beds / Hospital |
86
|
84
|
87
|
87
|
86
|
84
|
77
|
73
|
81
|
| Capita
/ Hospital bed |
412
|
417
|
420
|
412
|
446
|
446
|
450
|
497
|
517
|
| No.
of physicians |
755
|
722
|
741
|
750
|
526
|
530
|
537
|
511
|
471
|
| Capita
/ Physician |
3,953
|
4,109
|
3,999
|
3,936
|
5,592
|
5,484
|
5,403
|
5,644
|
6,102
|
|
No. of dentists |
163
|
169
|
172
|
163
|
136
|
127
|
120
|
107
|
106
|
|
Capita / Dentist |
18,311
|
17,557
|
17,229
|
18,114
|
21,628
|
22,886
|
24,180
|
26,956
|
27,117
|
| No.
of nurses |
4,069
|
3,661
|
3,583
|
3,213
|
3,310
|
2,941
|
2,575
|
2,124
|
1,994
|
|
|
| Education |
2002 |
2000 |
1998 |
1996 |
1994 |
1993 |
| No.
of teachers |
-
|
28,513
|
26,511
|
28,042
|
28,478
|
27,865
|
| No.
of students |
-
|
523,703
|
510,355
|
493,737
|
485,440
|
472,452
|
| No.
of schools |
-
|
1,899
|
1,947
|
1,993
|
2,001
|
2,011
|
| No.
of classrooms |
-
|
20,851
|
21,334
|
21,418
|
21,148
|
20,489
|
| Ratio
: students / teacher |
-
|
18.4
|
19.3
|
17.6
|
17.0
|
17.0
|
| Ratio
: students / classroom |
-
|
25.1
|
23.9
|
23.1
|
23.0
|
23.1
|
|
|
| |
|

