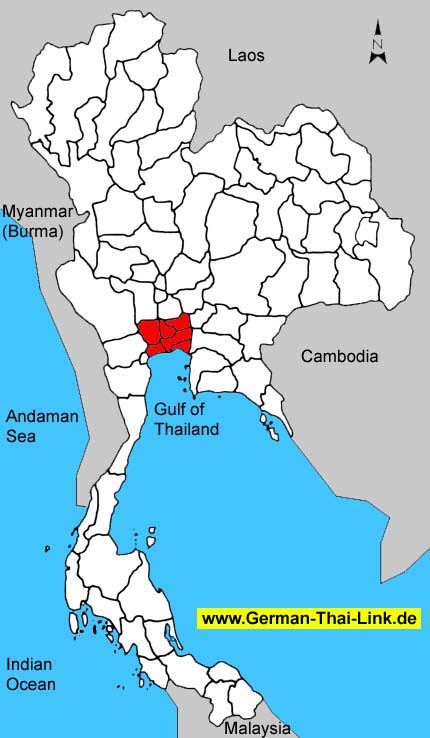
|

|
| General
Information |
| Area
sq km |
7,757
|
|
|
Anual
rainfall mm (2002) |
1,363
|
| Forest
Land (1999) |
22
|
0.3 %
|
Days
of rain (2002) |
122
|
| Farm
Land (1999) |
3,118
|
40.2 %
|
Mean
Temperature High/Low (2002) |
33.3
/
25.0
|
| Unclassified
Land (1999) |
4,617
|
59.5 %
|
BOI
Zone |
-
|
| Population
/ sq. km (2003) |
1,265
|
|
Gross
provincial product rank (2001) |
-
|
|
|
| Population |
2003 |
2002 |
2001 |
2000 |
1999 |
1998 |
1997 |
1996 |
| Male |
48.3 %
|
46.4 %
|
48.5 %
|
48.6 %
|
48.7 %
|
48.9 %
|
49.0 %
|
49.1 %
|
| Female |
51.7 %
|
53.6 %
|
51.5 %
|
51.4 %
|
51.3 %
|
51.1 %
|
51.0 %
|
50.9 %
|
| Total |
9,815,354
|
9,668,854
|
9,528,891
|
9,400,473
|
9,308,874
|
9,242,038
|
9,114,812
|
9,008,994
|
|
|
| Household
income (baht) |
2002 |
2000 |
1998 |
1996 |
1994 |
| Average
monthly income |
26,460
|
23,612
|
23,533
|
21,301
|
15,626
|
| Average
monthly expenditures |
19,985
|
18,595
|
18,808
|
16,765
|
13,260
|
| Voluntary
reserves |
24.5 %
|
21.2 %
|
20.1 %
|
21.3 %
|
15.1 %
|
| Monthly
income / Person |
8,018
|
7,155
|
6,921
|
6,454
|
4,735
|
| Average
household size |
3.3
|
3.3
|
3.4
|
3.3
|
3.3
|
|
|
| Gross
provincial product |
2001 |
2000 |
1999 |
1998 |
1997 |
1996 |
1995 |
1994 |
| Agriculture |
2.4 %
|
2.5 %
|
2.4 %
|
2.7 %
|
2.2 %
|
2.1 %
|
2.2 %
|
2.2 %
|
| Manufacturing |
38.9 %
|
38.8 %
|
38.4 %
|
37.2 %
|
35.6 %
|
35.3 %
|
35.2 %
|
34.9 %
|
| Construction |
2.9 %
|
2.2 %
|
3.2 %
|
4.1 %
|
5.0 %
|
6.5 %
|
6.5 %
|
6.8 %
|
| Transport
& communication |
11.9 %
|
11.6 %
|
11.4 %
|
11.1 %
|
10.3 %
|
9.8 %
|
9.7 %
|
9.7 %
|
| Wholesale
& retail trade |
17.2 %
|
18.0 %
|
17.9 %
|
16.8 %
|
17.4 %
|
16.3 %
|
17.0 %
|
17.0 %
|
| Services |
15.7 %
|
15.6 %
|
15.4 %
|
14.5 %
|
14.0 %
|
16.7 %
|
13.1 %
|
12.9 %
|
| Others |
11.0 %
|
11.3 %
|
11.3 %
|
13.6 %
|
15.5 %
|
13.3 %
|
16.3 %
|
16.5 %
|
|
|
|
|
|
|
|
|
|
| Total
(million baht) |
2,472,662
|
2,367,181
|
2,252,154
|
2,244,389
|
2,388,373
|
2,354,272
|
2,161,346
|
1,906,161
|
| GPP
per capita (baht) |
259,491
|
251,815
|
241,936
|
242,845
|
262,032
|
261,324
|
240,013
|
213,311
|
|
|
| Commercial
bank |
2003 |
2002 |
2001 |
2000 |
1999 |
1998 |
1997 |
1996 |
| No.
of offices |
1,659
|
1,593
|
1,577
|
1,603
|
1,279
|
1,279
|
1,260
|
1,194
|
| Deposits
(million baht) |
4,097,359
|
3,921,329
|
3,805,607
|
3,485,737
|
3,469,717
|
3,469,717
|
3,080,318
|
2,529,449
|
| Loans
(million baht) |
3,824,674
|
3,822,382
|
3,560,114
|
4,179,980
|
4,234,559
|
4,287,588
|
5,043,587
|
3,430,355
|
| Deposits
/ capita (baht) |
435,867
|
421,246
|
411,771
|
382,425
|
385,139
|
385,305
|
344,706
|
286,077
|
| Loans/deposits
ratio |
93.3 %
|
97.5 %
|
93.5 %
|
119.9 %
|
122.0 %
|
123.6 %
|
163.7 %
|
135.6 %
|
|
|
| Public
health |
2001 |
2000 |
1999 |
1998 |
1997 |
1996 |
1995 |
1994 |
1993 |
| No.
of hospitals |
212
|
220
|
249
|
248
|
200
|
181
|
165
|
145
|
136
|
| No.
of hospital beds |
41,679
|
41,609
|
41,496
|
41,100
|
40,567
|
34,324
|
28,085
|
27,268
|
25,204
|
| Avg.
Beds / Hospital |
196
|
189
|
166
|
165
|
202
|
189
|
170
|
188
|
185
|
| Capita
/ Hospital bed |
228
|
225
|
224
|
224
|
224
|
262
|
320
|
327
|
350
|
| No.
of physicians |
8,876
|
8,290
|
8,740
|
8,745
|
8,775
|
7,801
|
6,830
|
7,094
|
6,921
|
| Capita
/ Physician |
1,073
|
1,133
|
1,065
|
1,056
|
1,038
|
1,154
|
1,318
|
1,259
|
1,277
|
|
No. of dentists |
2,058
|
1,879
|
2,143
|
2,109
|
1,833
|
1,592
|
1,354
|
1,486
|
1,468
|
|
Capita / Dentist |
4,630
|
5,002
|
4,343
|
4,382
|
4,972
|
5,658
|
6,650
|
6,013
|
6,023
|
| No.
of nurses |
24,725
|
22,454
|
22,758
|
22,048
|
18,502
|
19,337
|
20,174
|
19,367
|
17,493
|
|
|
| Education |
2002 |
2000 |
1998 |
1996 |
1994 |
1993 |
| No.
of teachers |
-
|
83,391
|
84,702
|
82,411
|
81,551
|
79,910
|
| No.
of students |
-
|
1,730,392
|
1,671,684
|
1,633,508
|
1,617,321
|
1,573,412
|
| No.
of schools |
-
|
2,772
|
2,769
|
2,744
|
2,686
|
2,692
|
| No.
of classrooms |
-
|
49,238
|
48,799
|
47,792
|
47,528
|
46,535
|
| Ratio
: students / teacher |
-
|
20.8
|
19.7
|
19.8
|
19.8
|
19.7
|
| Ratio
: students / classroom |
-
|
35.1
|
34.3
|
34.2
|
34.0
|
33.8
|
|
|
| |
|


