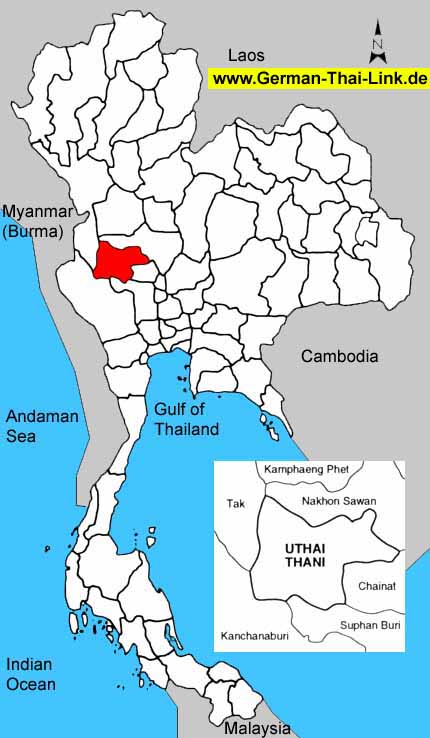
Uthai Thani is situated in the lower part of the northern region. Recent
excavation have indicated that this area was inhabited by prehistoric
people.
|
| General
Information |
| Area
sq km |
6,730
|
|
|
Anual
rainfall mm (2002) |
-
|
| Forest
Land (1999) |
2,576
|
38.3 %
|
Days
of rain (2002) |
-
|
| Farm
Land (1999) |
2,134
|
31.7 %
|
Mean
Temperature High/Low (2002) |
-
/
-
|
| Unclassified
Land (1999) |
2,020
|
30.0 %
|
BOI
Zone |
3
|
| Population
/ sq. km (2003) |
50
|
|
Gross
provincial product rank (2001) |
70
|
|
|
| Population |
2003 |
2002 |
2001 |
2000 |
1999 |
1998 |
1997 |
1996 |
| Male |
49.4 %
|
49.4 %
|
49.4 %
|
49.4 %
|
49.3 %
|
49.4 %
|
49.4 %
|
49.5 %
|
| Female |
50.6 %
|
50.6 %
|
50.6 %
|
50.6 %
|
50.7 %
|
50.6 %
|
50.6 %
|
50.5 %
|
| Total |
339,483
|
336,176
|
333,909
|
333,126
|
332,063
|
331,295
|
328,978
|
326,997
|
|
|
| Household
income (baht) |
2002 |
2000 |
1998 |
1996 |
1994 |
| Average
monthly income |
6,519
|
9,598
|
7,887
|
8,203
|
4,972
|
| Average
monthly expenditures |
5,732
|
7,247
|
7,000
|
6,551
|
5,578
|
| Voluntary
reserves |
12.1 %
|
24.5 %
|
11.2 %
|
20.1 %
|
-
|
| Monthly
income / Person |
1,917
|
2,742
|
2,390
|
2,343
|
1,381
|
| Average
household size |
3.4
|
3.5
|
3.3
|
3.5
|
3.6
|
|
|
| Gross
provincial product |
2001 |
2000 |
1999 |
1998 |
1997 |
1996 |
1995 |
1994 |
| Agriculture |
30.1 %
|
32.9 %
|
29.3 %
|
34.3 %
|
32.1 %
|
26.5 %
|
23.4 %
|
26.1 %
|
| Manufacturing |
7.3 %
|
6.7 %
|
6.7 %
|
6.5 %
|
6.3 %
|
5.4 %
|
5.4 %
|
5.2 %
|
| Construction |
2.3 %
|
5.2 %
|
5.2 %
|
5.0 %
|
7.1 %
|
8.6 %
|
9.5 %
|
7.1 %
|
| Transport
& communication |
4.0 %
|
3.3 %
|
3.3 %
|
3.2 %
|
3.3 %
|
2.8 %
|
2.9 %
|
3.4 %
|
| Wholesale
& retail trade |
17.2 %
|
16.1 %
|
16.1 %
|
15.8 %
|
18.1 %
|
15.1 %
|
16.8 %
|
17.8 %
|
| Services |
20.3 %
|
17.6 %
|
17.6 %
|
16.0 %
|
15.1 %
|
25.4 %
|
25.4 %
|
23.0 %
|
| Others |
18.8 %
|
18.2 %
|
21.8 %
|
19.2 %
|
18.0 %
|
16.2 %
|
16.6 %
|
17.4 %
|
|
|
|
|
|
|
|
|
|
| Total
(million baht) |
11,299
|
11,980
|
11,980
|
11,284
|
10,784
|
12,018
|
10,482
|
8,779
|
| GPP
per capita (baht) |
33,838
|
35,962
|
36,077
|
34,060
|
32,780
|
36,752
|
32,071
|
27,037
|
|
|
| Commercial
bank |
2003 |
2002 |
2001 |
2000 |
1999 |
1998 |
1997 |
1996 |
| No.
of offices |
12
|
12
|
12
|
15
|
15
|
15
|
15
|
14
|
| Deposits
(million baht) |
5,036
|
4,772
|
6,664
|
6,236
|
6,559
|
6,559
|
6,427
|
5,951
|
| Loans
(million baht) |
3,038
|
2,615
|
2,448
|
2,872
|
3,213
|
3,213
|
3,572
|
3,820
|
| Deposits
/ capita (baht) |
15,117
|
14,370
|
20,115
|
18,955
|
20,058
|
20,068
|
19,793
|
18,502
|
| Loans/deposits
ratio |
60.3 %
|
54.8 %
|
36.7 %
|
46.1 %
|
49.0 %
|
49.0 %
|
55.6 %
|
64.2 %
|
|
|
| Public
health |
2001 |
2000 |
1999 |
1998 |
1997 |
1996 |
1995 |
1994 |
1993 |
| No.
of hospitals |
9
|
8
|
8
|
8
|
9
|
8
|
8
|
8
|
8
|
| No.
of hospital beds |
660
|
610
|
600
|
600
|
580
|
530
|
480
|
460
|
460
|
| Avg.
Beds / Hospital |
73
|
76
|
75
|
75
|
64
|
66
|
60
|
57
|
57
|
| Capita
/ Hospital bed |
505
|
546
|
553
|
552
|
567
|
616
|
680
|
705
|
699
|
| No.
of physicians |
53
|
50
|
59
|
65
|
53
|
47
|
42
|
36
|
41
|
| Capita
/ Physician |
6,300
|
6,662
|
5,628
|
5,096
|
6,207
|
6,957
|
7,781
|
9,019
|
7,844
|
|
No. of dentists |
15
|
16
|
17
|
17
|
15
|
13
|
11
|
11
|
8
|
|
Capita / Dentist |
22,260
|
20,820
|
19,533
|
19,487
|
21,931
|
25,153
|
29,712
|
29,518
|
40,203
|
| No.
of nurses |
341
|
347
|
331
|
316
|
275
|
260
|
245
|
230
|
197
|
|
|
| Education |
2002 |
2000 |
1998 |
1996 |
1994 |
1993 |
| No.
of teachers |
-
|
3,440
|
3,439
|
3,380
|
3,313
|
3,242
|
| No.
of students |
-
|
61,103
|
60,152
|
58,202
|
56,876
|
54,472
|
| No.
of schools |
-
|
296
|
296
|
298
|
301
|
306
|
| No.
of classrooms |
-
|
2,869
|
2,888
|
2,917
|
2,821
|
2,808
|
| Ratio
: students / teacher |
-
|
17.8
|
17.5
|
17.2
|
17.2
|
16.8
|
| Ratio
: students / classroom |
-
|
21.3
|
20.8
|
20.0
|
20.2
|
19.4
|
|
|
| |
|

