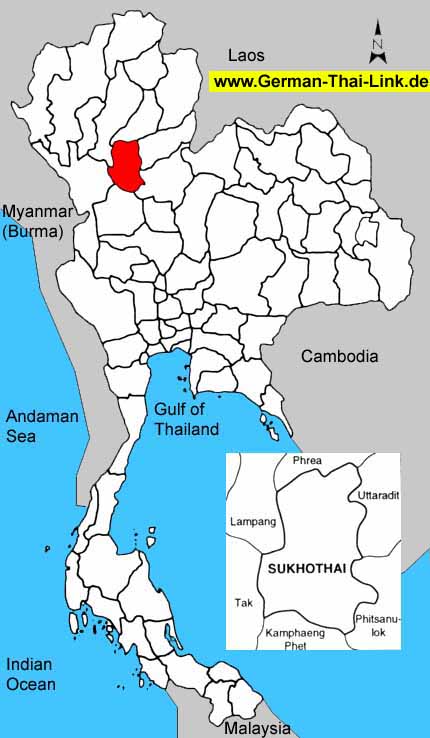
Sukhothai literally means "Dawn of Happiness". It is about 427 kms. (267
miles) north of Bangkok, and was founded in 1238. Sukhothai was capital
of Thailand for approximately 120 years.
The Sukhothai Historical Park - The former greatness of Sukhothai has
been preserved. Ruins of the royal palaces, Buddhist temples, the city
gates, walls, moats, dams, ditches, ponds, canals and the water control
system which was the magical and spiritual centre of the kingdom are now
preserved and restored by the Fine Arts Department with the co-operation
of UNESCO, not only with a view of fostering Thailand's national identity
but of safeguarding a fine example of mankind's cultural heritage. There
is a Tourist Service Center near Wat Phra Phai Luang. The center provides
information and facilitates visitors to the Sukhothai Historical Park,
as well as display models of historical buildings and structures in the
old city of Sukhothai.
The walls of The Old City are located in the centre of the historical
park in Tambon Muang Kao and surrounded by earthern ramparts. The north
and the south walls are each 2,000 meters long. The walls contain four
main gates : Sanluang on the north, Namo on the south, Kamphaenghak on
the east, and Oar on the west. A stone inscription mentions that King
Ramkhamhaeng set up a bell at one of the gates. The Royal Palace and Wat
Mahathat lies on the centre of the town and covers an area of 160,000
square meters. This area is surrounded by a moat and contains two main
compounds ; the royal building and the sanctuary in the palace. In the
royal compound exist the ruins of the royal building called Noen Phrasat,
which might be Sala Phranmat or Buddha Sala mentioned in a Sukhothai stone
inscription.
|
| General
Information |
| Area
sq km |
6,596
|
|
|
Anual
rainfall mm (2002) |
-
|
| Forest
Land (1999) |
2,207
|
33.5 %
|
Days
of rain (2002) |
-
|
| Farm
Land (1999) |
3,077
|
46.6 %
|
Mean
Temperature High/Low (2002) |
33.0
/
22.3
|
| Unclassified
Land (1999) |
1,312
|
19.9 %
|
BOI
Zone |
3
|
| Population
/ sq. km (2003) |
94
|
|
Gross
provincial product rank (2001) |
50
|
|
|
| Population |
2003 |
2002 |
2001 |
2000 |
1999 |
1998 |
1997 |
1996 |
| Male |
48.9 %
|
48.9 %
|
48.8 %
|
48.9 %
|
48.9 %
|
48.9 %
|
48.9 %
|
48.9 %
|
| Female |
51.1 %
|
51.1 %
|
51.2 %
|
51.1 %
|
51.1 %
|
51.1 %
|
51.1 %
|
51.1 %
|
| Total |
621,693
|
625,099
|
624,064
|
625,333
|
627,585
|
630,292
|
627,090
|
616,243
|
|
|
| Household
income (baht) |
2002 |
2000 |
1998 |
1996 |
1994 |
| Average
monthly income |
8,299
|
7,156
|
10,475
|
8,320
|
5,044
|
| Average
monthly expenditures |
6,330
|
5,892
|
6,598
|
5,489
|
4,962
|
| Voluntary
reserves |
23.7 %
|
17.7 %
|
37.0 %
|
34.0 %
|
1.6 %
|
| Monthly
income / Person |
2,593
|
2,044
|
2,909
|
2,447
|
1,441
|
| Average
household size |
3.2
|
3.5
|
3.6
|
3.4
|
3.5
|
|
|
| Gross
provincial product |
2001 |
2000 |
1999 |
1998 |
1997 |
1996 |
1995 |
1994 |
| Agriculture |
28.5 %
|
26.0 %
|
28.0 %
|
33.2 %
|
29.3 %
|
28.3 %
|
25.3 %
|
27.8 %
|
| Manufacturing |
10.4 %
|
10.8 %
|
9.5 %
|
8.9 %
|
8.7 %
|
8.7 %
|
9.6 %
|
8.8 %
|
| Construction |
2.3 %
|
3.4 %
|
3.9 %
|
3.7 %
|
5.8 %
|
8.2 %
|
8.6 %
|
7.2 %
|
| Transport
& communication |
4.5 %
|
4.5 %
|
4.0 %
|
3.8 %
|
5.0 %
|
4.7 %
|
4.9 %
|
4.8 %
|
| Wholesale
& retail trade |
20.3 %
|
19.9 %
|
19.5 %
|
18.0 %
|
20.6 %
|
19.7 %
|
21.0 %
|
21.3 %
|
| Services |
15.9 %
|
15.8 %
|
15.8 %
|
13.4 %
|
13.3 %
|
12.8 %
|
12.5 %
|
12.1 %
|
| Others |
18.1 %
|
19.6 %
|
19.3 %
|
19.0 %
|
17.3 %
|
17.6 %
|
18.1 %
|
18.0 %
|
|
|
|
|
|
|
|
|
|
| Total
(million baht) |
19,894
|
18,976
|
18,531
|
19,469
|
18,609
|
18,191
|
16,527
|
14,563
|
| GPP
per capita (baht) |
31,878
|
30,345
|
29,527
|
30,888
|
29,675
|
29,519
|
26,705
|
23,473
|
|
|
| Commercial
bank |
2003 |
2002 |
2001 |
2000 |
1999 |
1998 |
1997 |
1996 |
| No.
of offices |
18
|
18
|
21
|
23
|
22
|
22
|
25
|
25
|
| Deposits
(million baht) |
11,342
|
11,307
|
11,387
|
10,054
|
10,851
|
10,851
|
10,655
|
10,241
|
| Loans
(million baht) |
5,793
|
5,786
|
5,167
|
5,764
|
6,778
|
6,778
|
7,786
|
8,182
|
| Deposits
/ capita (baht) |
18,137
|
18,016
|
18,066
|
16,032
|
17,608
|
17,534
|
17,174
|
16,678
|
| Loans/deposits
ratio |
51.1 %
|
51.2 %
|
45.4 %
|
57.3 %
|
62.5 %
|
62.5 %
|
73.1 %
|
79.9 %
|
|
|
| Public
health |
2001 |
2000 |
1999 |
1998 |
1997 |
1996 |
1995 |
1994 |
1993 |
| No.
of hospitals |
12
|
12
|
12
|
12
|
12
|
12
|
12
|
11
|
10
|
| No.
of hospital beds |
1,196
|
1,147
|
1,081
|
1,181
|
1,148
|
1,062
|
976
|
786
|
740
|
| Avg.
Beds / Hospital |
99
|
95
|
90
|
98
|
95
|
88
|
81
|
71
|
74
|
| Capita
/ Hospital bed |
521
|
545
|
580
|
533
|
546
|
580
|
634
|
789
|
829
|
| No.
of physicians |
167
|
138
|
105
|
73
|
95
|
82
|
70
|
63
|
59
|
| Capita
/ Physician |
3,736
|
4,531
|
5,977
|
8,634
|
6,600
|
7,515
|
8,840
|
9,847
|
10,407
|
|
No. of dentists |
34
|
36
|
26
|
24
|
21
|
18
|
15
|
13
|
12
|
|
Capita / Dentist |
18,354
|
17,370
|
24,137
|
26,262
|
29,861
|
34,235
|
41,256
|
47,722
|
51,169
|
| No.
of nurses |
805
|
840
|
532
|
497
|
540
|
471
|
402
|
368
|
321
|
|
|
| Education |
2002 |
2000 |
1998 |
1996 |
1994 |
1993 |
| No.
of teachers |
-
|
5,783
|
5,884
|
5,713
|
5,767
|
5,715
|
| No.
of students |
-
|
106,696
|
106,607
|
105,333
|
100,316
|
96,748
|
| No.
of schools |
-
|
406
|
421
|
421
|
416
|
418
|
| No.
of classrooms |
-
|
4,590
|
4,590
|
4,535
|
4,272
|
4,229
|
| Ratio
: students / teacher |
-
|
18.4
|
18.1
|
18.4
|
17.4
|
16.9
|
| Ratio
: students / classroom |
-
|
23.2
|
23.2
|
23.2
|
23.5
|
22.9
|
|
|
| |
|

