Phichit was probably built by Phraya Khot Thabong in 1058. The community
was named Sa Luang during the Sukhothai Period (1238-1350) and was designated
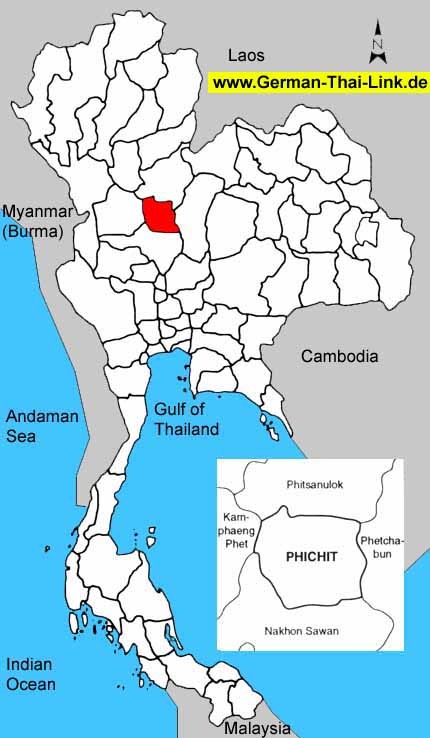
a Thai province during the reign of King Rama V(1868-1910). The province
is 344 kilometers north of Bangkok.
The Old City Park It is located on Phichit - Wang Chik Rd., about 8
kms. from Phichit township. It is believed that this area used to be the
old Phichit town approximately 900 years ago. In the park, there is and
arboretum, a peaceful relaxing placed for local people. In addition, there
are Ko Si Mala, Tham Chalawan and sculptures of important features from
a thai literature, 'Kraithong'.
|
| General
Information |
| Area
sq km |
4,531
|
|
|
Anual
rainfall mm (2002) |
-
|
| Forest
Land (1999) |
-
|
-
|
Days
of rain (2002) |
-
|
| Farm
Land (1999) |
3,358
|
74.1 %
|
Mean
Temperature High/Low (2002) |
-
/
-
|
| Unclassified
Land (1999) |
1,173
|
25.9 %
|
BOI
Zone |
3
|
| Population
/ sq. km (2003) |
131
|
|
Gross
provincial product rank (2001) |
52
|
|
|
| Population |
2003 |
2002 |
2001 |
2000 |
1999 |
1998 |
1997 |
1996 |
| Male |
49.1 %
|
49.1 %
|
49.1 %
|
49.1 %
|
32.4 %
|
49.1 %
|
49.1 %
|
49.1 %
|
| Female |
50.9 %
|
50.9 %
|
50.9 %
|
50.9 %
|
67.6 %
|
50.9 %
|
50.9 %
|
50.9 %
|
| Total |
597,882
|
591,953
|
591,412
|
593,811
|
598,406
|
604,039
|
601,117
|
597,202
|
|
|
| Household
income (baht) |
2002 |
2000 |
1998 |
1996 |
1994 |
| Average
monthly income |
10,887
|
8,318
|
11,185
|
10,324
|
7,350
|
| Average
monthly expenditures |
9,024
|
8,179
|
8,825
|
7,918
|
6,435
|
| Voluntary
reserves |
17.1 %
|
1.7 %
|
21.1 %
|
23.3 %
|
12.4 %
|
| Monthly
income / Person |
3,299
|
2,446
|
3,389
|
3,036
|
2,041
|
| Average
household size |
3.3
|
3.4
|
3.3
|
3.4
|
3.6
|
|
|
| Gross
provincial product |
2001 |
2000 |
1999 |
1998 |
1997 |
1996 |
1995 |
1994 |
| Agriculture |
29.7 %
|
30.9 %
|
32.4 %
|
42.2 %
|
36.6 %
|
30.9 %
|
26.2 %
|
26.7 %
|
| Manufacturing |
7.5 %
|
7.3 %
|
6.4 %
|
5.6 %
|
5.7 %
|
6.0 %
|
6.6 %
|
6.9 %
|
| Construction |
3.7 %
|
5.1 %
|
4.8 %
|
2.9 %
|
6.0 %
|
9.1 %
|
9.7 %
|
8.7 %
|
| Transport
& communication |
3.7 %
|
3.3 %
|
3.2 %
|
3.1 %
|
3.5 %
|
3.6 %
|
4.4 %
|
4.5 %
|
| Wholesale
& retail trade |
20.0 %
|
19.0 %
|
18.1 %
|
15.5 %
|
18.6 %
|
18.8 %
|
21.1 %
|
21.5 %
|
| Services |
17.1 %
|
16.3 %
|
15.3 %
|
12.8 %
|
13.3 %
|
13.3 %
|
13.7 %
|
13.1 %
|
| Others |
18.3 %
|
18.1 %
|
19.8 %
|
17.9 %
|
16.3 %
|
18.3 %
|
18.3 %
|
18.6 %
|
|
|
|
|
|
|
|
|
|
| Total
(million baht) |
18,596
|
18,538
|
18,557
|
20,831
|
19,012
|
17,490
|
15,110
|
13,227
|
| GPP
per capita (baht) |
31,443
|
31,218
|
31,010
|
34,486
|
31,627
|
29,286
|
25,356
|
22,202
|
|
|
| Commercial
bank |
2003 |
2002 |
2001 |
2000 |
1999 |
1998 |
1997 |
1996 |
| No.
of offices |
26
|
26
|
29
|
31
|
30
|
30
|
33
|
33
|
| Deposits
(million baht) |
13,611
|
13,841
|
14,434
|
12,829
|
13,122
|
13,122
|
12,996
|
11,891
|
| Loans
(million baht) |
7,437
|
6,166
|
5,412
|
6,622
|
7,297
|
7,297
|
8,716
|
9,229
|
| Deposits
/ capita (baht) |
22,921
|
23,129
|
23,895
|
21,341
|
21,972
|
22,020
|
21,814
|
20,078
|
| Loans/deposits
ratio |
54.6 %
|
44.5 %
|
37.5 %
|
51.6 %
|
55.6 %
|
55.6 %
|
67.1 %
|
77.6 %
|
|
|
| Public
health |
2001 |
2000 |
1999 |
1998 |
1997 |
1996 |
1995 |
1994 |
1993 |
| No.
of hospitals |
12
|
12
|
12
|
12
|
10
|
10
|
10
|
10
|
8
|
| No.
of hospital beds |
1,079
|
975
|
1,113
|
1,072
|
892
|
871
|
850
|
810
|
582
|
| Avg.
Beds / Hospital |
89
|
81
|
92
|
89
|
89
|
87
|
85
|
81
|
72
|
| Capita
/ Hospital bed |
548
|
609
|
537
|
563
|
673
|
685
|
701
|
735
|
1,017
|
| No.
of physicians |
64
|
129
|
73
|
122
|
71
|
72
|
73
|
71
|
48
|
| Capita
/ Physician |
9,240
|
4,603
|
8,197
|
4,951
|
8,466
|
8,294
|
8,163
|
8,390
|
12,338
|
|
No. of dentists |
26
|
34
|
18
|
32
|
18
|
18
|
19
|
19
|
17
|
|
Capita / Dentist |
22,746
|
17,465
|
33,244
|
18,876
|
33,395
|
33,177
|
31,363
|
31,354
|
34,836
|
| No.
of nurses |
482
|
686
|
435
|
441
|
399
|
357
|
315
|
300
|
250
|
|
|
| Education |
2002 |
2000 |
1998 |
1996 |
1994 |
1993 |
| No.
of teachers |
-
|
5,789
|
5,821
|
5,693
|
5,715
|
5,585
|
| No.
of students |
-
|
96,797
|
95,521
|
93,956
|
93,120
|
87,413
|
| No.
of schools |
-
|
434
|
447
|
446
|
446
|
449
|
| No.
of classrooms |
-
|
4,572
|
4,562
|
4,562
|
4,364
|
4,164
|
| Ratio
: students / teacher |
-
|
16.7
|
16.4
|
16.5
|
16.3
|
15.7
|
| Ratio
: students / classroom |
-
|
21.2
|
20.9
|
20.6
|
21.3
|
21.0
|
|
|
| |
|

