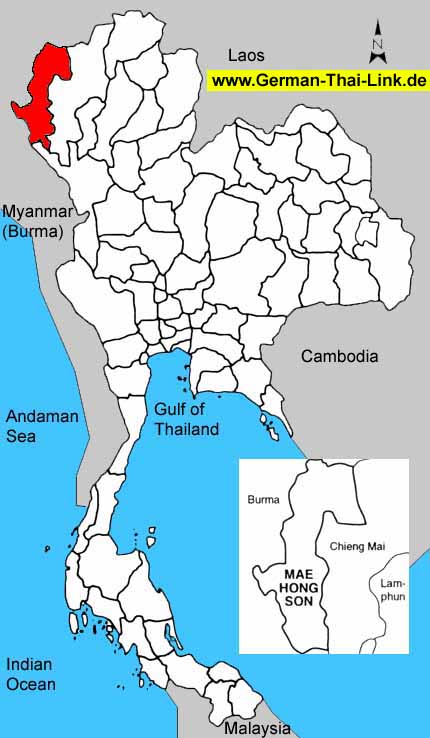
Mae Hong Son, Thailand's second northernmost provincial capital, is sheltered
by several high mountains and enjoys a cool climate almost all year round.
In the past, the town was isolated from the outside world for lack of
good transportation and communications. The province is bordered by Myanmar
to the North and West, and a strong Myanmar influence can be seen in the
provincial capital's temples and buildings. Mae Hong Son can be reached
from Chiang Mai either by Highway No. 108 via Mae Sa Riang, or Highway
No. 1095 via Pai which shortens the distance to some 274 kilometers.
Numerous Myanmar-style temples can by seen. These include the hilltop
Wat Phrathat Doi Kong Mu which dominates the provincial capital. Constructed
by Phraya Singhanatracha, the first King of Mae Hong Son, the hilltop
temple affords a wonderful view of the capital and surrounding mountains
and valleys.
About 12 kilometers outside Mae Hong Son, the Pha Bong Dam been constructed
across the Mae Ra Mat River for generating electrical power.
Nearby are the Pha Bong and Nam Hu Hai Chai Springs. Along Highway no.108.
The Tribal Development Assistance Centre at Km. 84 on Doi Mae Ho is administered
by the Public Welfare department. Most of the hill tribe people in this
centre are of Karen ancestry. The scenic area is noted for colorful flower
plantations.
Two interesting caves along this highway are Tham Mae Hu at Km. 108,
and Tham Mae La Ka between Amphoe Kun Yuam and Mae La Noi. In the vicinity
are Mae Hu and Mae La Ka Hot Springs. Both have water hot enough to boil
eggs.
At km. 220 on Highway No.108, some 30 kilometers from Amphoe Khun Yuam
is the Nam tok Mae Surin National Park which is believed to be Thailand's
highest falls.
|
| General
Information |
| Area
sq km |
12,681
|
|
|
Anual
rainfall mm (2002) |
1,561
|
| Forest
Land (1999) |
8,711
|
68.7 %
|
Days
of rain (2002) |
137
|
| Farm
Land (1999) |
392
|
3.1 %
|
Mean
Temperature High/Low (2002) |
33.0
/
20.2
|
| Unclassified
Land (1999) |
3,578
|
28.2 %
|
BOI
Zone |
3
|
| Population
/ sq. km (2003) |
18
|
|
Gross
provincial product rank (2001) |
76
|
|
|
| Population |
2003 |
2002 |
2001 |
2000 |
1999 |
1998 |
1997 |
1996 |
| Male |
51.7 %
|
51.8 %
|
51.8 %
|
51.8 %
|
51.8 %
|
51.8 %
|
51.9 %
|
51.9 %
|
| Female |
48.3 %
|
48.2 %
|
48.2 %
|
48.2 %
|
48.2 %
|
48.2 %
|
48.1 %
|
48.1 %
|
| Total |
238,241
|
240,014
|
236,993
|
234,226
|
232,483
|
232,938
|
229,284
|
226,922
|
|
|
| Household
income (baht) |
2002 |
2000 |
1998 |
1996 |
1994 |
| Average
monthly income |
6,696
|
6,317
|
5,934
|
6,187
|
4,088
|
| Average
monthly expenditures |
5,884
|
5,225
|
5,249
|
5,045
|
3,409
|
| Voluntary
reserves |
12.1 %
|
17.3 %
|
11.5 %
|
18.5 %
|
16.6 %
|
| Monthly
income / Person |
1,969
|
1,754
|
1,521
|
1,438
|
1,048
|
| Average
household size |
3.4
|
3.6
|
3.9
|
4.3
|
3.9
|
|
|
| Gross
provincial product |
2001 |
2000 |
1999 |
1998 |
1997 |
1996 |
1995 |
1994 |
| Agriculture |
19.6 %
|
19.3 %
|
22.6 %
|
25.6 %
|
29.2 %
|
22.5 %
|
18.5 %
|
19.8 %
|
| Manufacturing |
3.9 %
|
3.8 %
|
3.3 %
|
3.4 %
|
3.0 %
|
3.2 %
|
3.5 %
|
3.5 %
|
| Construction |
3.8 %
|
5.6 %
|
3.5 %
|
4.7 %
|
6.4 %
|
10.1 %
|
10.2 %
|
10.4 %
|
| Transport
& communication |
5.5 %
|
4.1 %
|
3.8 %
|
3.9 %
|
4.4 %
|
4.5 %
|
4.2 %
|
3.9 %
|
| Wholesale
& retail trade |
19.7 %
|
20.2 %
|
19.1 %
|
19.2 %
|
18.8 %
|
18.7 %
|
19.6 %
|
19.6 %
|
| Services |
21.4 %
|
20.2 %
|
22.3 %
|
20.4 %
|
17.4 %
|
17.1 %
|
19.5 %
|
18.8 %
|
| Others |
26.1 %
|
26.8 %
|
25.4 %
|
22.8 %
|
20.8 %
|
23.9 %
|
24.5 %
|
24.0 %
|
|
|
|
|
|
|
|
|
|
| Total
(million baht) |
5,657
|
5,691
|
5,668
|
5,358
|
5,843
|
5,388
|
4,879
|
4,271
|
| GPP
per capita (baht) |
23,869
|
24,297
|
24,380
|
23,001
|
25,483
|
23,743
|
22,222
|
19,513
|
|
|
| Commercial
bank |
2003 |
2002 |
2001 |
2000 |
1999 |
1998 |
1997 |
1996 |
| No.
of offices |
8
|
8
|
9
|
10
|
10
|
10
|
10
|
9
|
| Deposits
(million baht) |
1,840
|
1,918
|
1,923
|
1,612
|
1,701
|
1,701
|
1,659
|
1,634
|
| Loans
(million baht) |
1,246
|
1,318
|
1,354
|
1,879
|
2,016
|
2,016
|
2,209
|
2,209
|
| Deposits
/ capita (baht) |
7,855
|
8,250
|
8,255
|
7,030
|
7,495
|
7,747
|
7,579
|
7,597
|
| Loans/deposits
ratio |
67.7 %
|
68.7 %
|
70.4 %
|
116.6 %
|
118.5 %
|
118.5 %
|
133.2 %
|
135.2 %
|
|
|
| Public
health |
2001 |
2000 |
1999 |
1998 |
1997 |
1996 |
1995 |
1994 |
1993 |
| No.
of hospitals |
9
|
9
|
8
|
8
|
8
|
8
|
8
|
8
|
7
|
| No.
of hospital beds |
461
|
475
|
430
|
419
|
360
|
355
|
350
|
300
|
290
|
| Avg.
Beds / Hospital |
51
|
52
|
53
|
52
|
45
|
44
|
43
|
37
|
41
|
| Capita
/ Hospital bed |
514
|
493
|
540
|
555
|
636
|
639
|
627
|
729
|
741
|
| No.
of physicians |
31
|
52
|
50
|
50
|
30
|
27
|
24
|
29
|
29
|
| Capita
/ Physician |
7,644
|
4,504
|
4,649
|
4,658
|
7,642
|
8,404
|
9,148
|
7,547
|
7,416
|
|
No. of dentists |
12
|
14
|
13
|
10
|
12
|
10
|
9
|
9
|
7
|
|
Capita / Dentist |
19,749
|
16,730
|
17,883
|
23,293
|
19,107
|
22,692
|
24,395
|
24,319
|
30,725
|
| No.
of nurses |
277
|
263
|
259
|
259
|
226
|
206
|
187
|
173
|
157
|
|
|
| Education |
2002 |
2000 |
1998 |
1996 |
1994 |
1993 |
| No.
of teachers |
-
|
2,308
|
2,278
|
2,144
|
2,173
|
1,997
|
| No.
of students |
-
|
48,816
|
47,920
|
45,251
|
41,264
|
36,215
|
| No.
of schools |
-
|
370
|
375
|
376
|
319
|
405
|
| No.
of classrooms |
-
|
2,939
|
2,947
|
2,500
|
2,193
|
2,040
|
| Ratio
: students / teacher |
-
|
21.2
|
21.0
|
21.1
|
19.0
|
18.1
|
| Ratio
: students / classroom |
-
|
16.6
|
16.3
|
18.1
|
18.8
|
17.8
|
|
|
| |
|

