|
| General
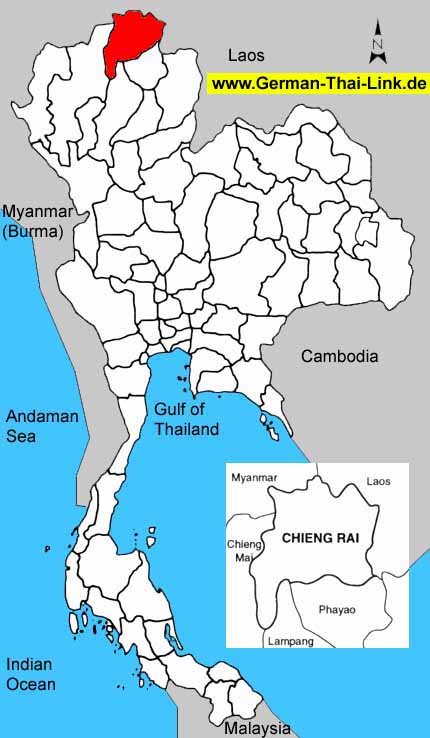
Information |
| Area
sq km |
11,678
|
|
|
Anual
rainfall mm (2002) |
1,753
|
| Forest
Land (1999) |
3,785
|
32.4 %
|
Days
of rain (2002) |
163
|
| Farm
Land (1999) |
3,395
|
29.1 %
|
Mean
Temperature High/Low (2002) |
30.9
/
19.9
|
| Unclassified
Land (1999) |
4,498
|
38.5 %
|
BOI
Zone |
3
|
| Population
/ sq. km (2003) |
104
|
|
Gross
provincial product rank (2001) |
26
|
|
|
| Population |
2003 |
2002 |
2001 |
2000 |
1999 |
1998 |
1997 |
1996 |
| Male |
49.8 %
|
49.8 %
|
49.9 %
|
49.9 %
|
50.0 %
|
50.1 %
|
50.2 %
|
50.2 %
|
| Female |
50.2 %
|
50.2 %
|
50.1 %
|
50.1 %
|
50.0 %
|
49.9 %
|
49.8 %
|
49.8 %
|
| Total |
1,214,913
|
1,274,214
|
1,263,169
|
1,259,988
|
1,265,091
|
1,268,569
|
1,261,138
|
1,253,202
|
|
|
| Household
income (baht) |
2002 |
2000 |
1998 |
1996 |
1994 |
| Average
monthly income |
8,369
|
7,930
|
8,924
|
7,955
|
6,248
|
| Average
monthly expenditures |
7,678
|
6,487
|
7,486
|
7,302
|
6,427
|
| Voluntary
reserves |
8.3 %
|
18.2 %
|
16.1 %
|
8.2 %
|
-
|
| Monthly
income / Person |
2,615
|
2,202
|
2,549
|
2,272
|
1,785
|
| Average
household size |
3.2
|
3.6
|
3.5
|
3.5
|
3.5
|
|
|
| Gross
provincial product |
2001 |
2000 |
1999 |
1998 |
1997 |
1996 |
1995 |
1994 |
| Agriculture |
23.4 %
|
21.3 %
|
19.8 %
|
23.8 %
|
21.4 %
|
20.6 %
|
16.6 %
|
17.2 %
|
| Manufacturing |
4.9 %
|
4.9 %
|
4.5 %
|
4.4 %
|
4.1 %
|
3.9 %
|
4.1 %
|
3.6 %
|
| Construction |
2.6 %
|
4.5 %
|
5.6 %
|
5.1 %
|
6.8 %
|
12.5 %
|
16.7 %
|
20.2 %
|
| Transport
& communication |
6.0 %
|
6.7 %
|
6.7 %
|
6.9 %
|
7.6 %
|
7.1 %
|
7.5 %
|
6.3 %
|
| Wholesale
& retail trade |
20.2 %
|
20.8 %
|
21.0 %
|
19.6 %
|
21.3 %
|
19.5 %
|
19.9 %
|
19.0 %
|
| Services |
22.4 %
|
20.9 %
|
20.8 %
|
18.1 %
|
17.8 %
|
16.1 %
|
15.0 %
|
14.4 %
|
| Others |
20.5 %
|
20.9 %
|
21.6 %
|
22.1 %
|
21.0 %
|
20.3 %
|
20.2 %
|
19.3 %
|
|
|
|
|
|
|
|
|
|
| Total
(million baht) |
34,606
|
34,303
|
32,207
|
33,078
|
32,947
|
33,293
|
31,235
|
29,022
|
| GPP
per capita (baht) |
27,396
|
27,224
|
25,458
|
26,075
|
26,124
|
26,566
|
24,884
|
23,137
|
|
|
| Commercial
bank |
2003 |
2002 |
2001 |
2000 |
1999 |
1998 |
1997 |
1996 |
| No.
of offices |
49
|
51
|
53
|
56
|
49
|
49
|
54
|
51
|
| Deposits
(million baht) |
27,685
|
28,121
|
30,138
|
27,463
|
28,626
|
28,626
|
27,741
|
25,378
|
| Loans
(million baht) |
17,523
|
17,771
|
16,352
|
19,314
|
21,056
|
21,056
|
24,979
|
25,846
|
| Deposits
/ capita (baht) |
21,972
|
22,228
|
23,757
|
21,776
|
22,842
|
22,805
|
22,115
|
20,340
|
| Loans/deposits
ratio |
63.3 %
|
63.2 %
|
54.3 %
|
70.3 %
|
73.6 %
|
73.6 %
|
90.0 %
|
101.8 %
|
|
|
| Public
health |
2001 |
2000 |
1999 |
1998 |
1997 |
1996 |
1995 |
1994 |
1993 |
| No.
of hospitals |
21
|
20
|
20
|
20
|
21
|
22
|
23
|
19
|
16
|
| No.
of hospital beds |
2,075
|
2,065
|
1,996
|
1,996
|
1,989
|
1,900
|
1,811
|
1,492
|
1,434
|
| Avg.
Beds / Hospital |
98
|
103
|
99
|
99
|
94
|
86
|
78
|
78
|
89
|
| Capita
/ Hospital bed |
608
|
610
|
633
|
635
|
634
|
659
|
693
|
840
|
870
|
| No.
of physicians |
181
|
165
|
170
|
163
|
124
|
131
|
138
|
130
|
117
|
| Capita
/ Physician |
6,978
|
7,636
|
7,441
|
7,782
|
10,170
|
9,566
|
9,095
|
9,648
|
10,663
|
|
No. of dentists |
45
|
42
|
35
|
37
|
34
|
34
|
34
|
27
|
23
|
|
Capita / Dentist |
28,070
|
29,999
|
36,145
|
34,285
|
37,092
|
36,858
|
36,917
|
46,457
|
54,245
|
| No.
of nurses |
1,078
|
904
|
828
|
753
|
722
|
655
|
589
|
500
|
455
|
|
|
| Education |
2002 |
2000 |
1998 |
1996 |
1994 |
1993 |
| No.
of teachers |
-
|
10,202
|
10,245
|
9,884
|
9,692
|
9,519
|
| No.
of students |
-
|
214,495
|
214,618
|
206,182
|
196,499
|
182,570
|
| No.
of schools |
-
|
788
|
807
|
818
|
792
|
813
|
| No.
of classrooms |
-
|
8,418
|
8,533
|
8,262
|
7,955
|
7,602
|
| Ratio
: students / teacher |
-
|
21.0
|
20.9
|
20.9
|
20.3
|
19.2
|
| Ratio
: students / classroom |
-
|
25.5
|
25.2
|
25.0
|
24.7
|
24.0
|
|
|
| |
|

