|
| General
Information |
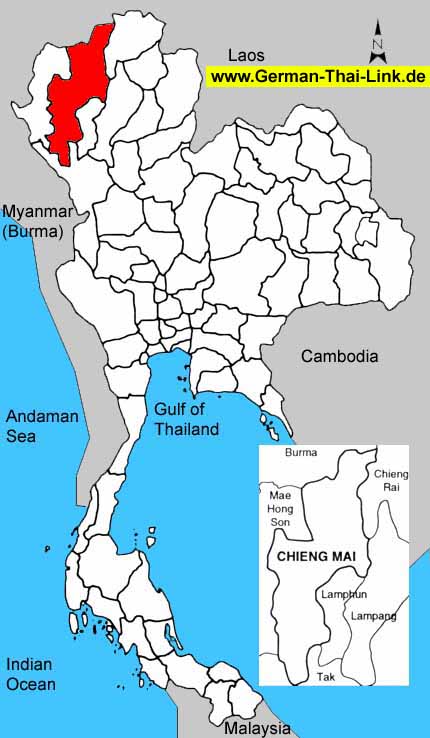
| Area
sq km |
20,107
|
|
|
Anual
rainfall mm (2002) |
1,612
|
| Forest
Land (1999) |
13,989
|
69.6 %
|
Days
of rain (2002) |
123
|
| Farm
Land (1999) |
2,194
|
10.9 %
|
Mean
Temperature High/Low (2002) |
31.8
/
21.1
|
| Unclassified
Land (1999) |
3,924
|
19.5 %
|
BOI
Zone |
3
|
| Population
/ sq. km (2003) |
79
|
|
Gross
provincial product rank (2001) |
9
|
|
|
| Population |
2003 |
2002 |
2001 |
2000 |
1999 |
1998 |
1997 |
1996 |
| Male |
49.3 %
|
49.4 %
|
49.4 %
|
49.5 %
|
49.6 %
|
49.7 %
|
49.9 %
|
50.0 %
|
| Female |
50.7 %
|
50.6 %
|
50.6 %
|
50.5 %
|
50.4 %
|
50.3 %
|
50.1 %
|
50.0 %
|
| Total |
1,603,320
|
1,595,855
|
1,600,850
|
1,590,327
|
1,587,465
|
1,582,222
|
1,573,757
|
1,564,438
|
|
|
| Household
income (baht) |
2002 |
2000 |
1998 |
1996 |
1994 |
| Average
monthly income |
9,582
|
9,243
|
10,379
|
9,806
|
7,755
|
| Average
monthly expenditures |
8,465
|
7,477
|
8,600
|
9,040
|
7,284
|
| Voluntary
reserves |
11.7 %
|
19.1 %
|
17.1 %
|
7.8 %
|
6.1 %
|
| Monthly
income / Person |
3,304
|
2,981
|
3,145
|
3,064
|
2,423
|
| Average
household size |
2.9
|
3.1
|
3.3
|
3.2
|
3.2
|
|
|
| Gross
provincial product |
2001 |
2000 |
1999 |
1998 |
1997 |
1996 |
1995 |
1994 |
| Agriculture |
10.2 %
|
10.9 %
|
12.8 %
|
14.7 %
|
13.5 %
|
13.8 %
|
10.6 %
|
11.1 %
|
| Manufacturing |
18.7 %
|
18.5 %
|
18.1 %
|
16.5 %
|
16.3 %
|
16.5 %
|
17.3 %
|
18.4 %
|
| Construction |
5.8 %
|
5.0 %
|
6.2 %
|
5.6 %
|
9.8 %
|
9.7 %
|
10.9 %
|
10.0 %
|
| Transport
& communication |
6.9 %
|
7.0 %
|
6.9 %
|
7.4 %
|
7.4 %
|
6.9 %
|
6.9 %
|
7.7 %
|
| Wholesale
& retail trade |
3.7 %
|
3.7 %
|
10.7 %
|
10.5 %
|
11.4 %
|
11.3 %
|
12.1 %
|
12.0 %
|
| Services |
29.0 %
|
28.0 %
|
27.2 %
|
23.9 %
|
22.1 %
|
22.3 %
|
22.0 %
|
20.7 %
|
| Others |
25.7 %
|
26.9 %
|
18.1 %
|
21.4 %
|
19.5 %
|
19.5 %
|
20.2 %
|
20.1 %
|
|
|
|
|
|
|
|
|
|
| Total
(million baht) |
86,584
|
83,244
|
81,397
|
81,617
|
82,444
|
78,381
|
71,451
|
63,914
|
| GPP
per capita (baht) |
54,086
|
52,343
|
51,274
|
51,583
|
52,386
|
50,101
|
45,734
|
41,079
|
|
|
| Commercial
bank |
2003 |
2002 |
2001 |
2000 |
1999 |
1998 |
1997 |
1996 |
| No.
of offices |
123
|
124
|
125
|
127
|
103
|
103
|
103
|
97
|
| Deposits
(million baht) |
84,163
|
81,986
|
83,922
|
76,970
|
78,242
|
74,184
|
3,690
|
68
|
| Loans
(million baht) |
68,732
|
63,385
|
56,162
|
67,777
|
74,475
|
80,152
|
80,922
|
78,242
|
| Deposits
/ capita (baht) |
52,921
|
51,645
|
53,040
|
48,908
|
50,012
|
47,484
|
2,371
|
44
|
| Loans/deposits
ratio |
81.7 %
|
77.3 %
|
66.9 %
|
88.1 %
|
95.2 %
|
108.0 %
|
2193.0 %
|
115061.8 %
|
|
|
| Public
health |
2001 |
2000 |
1999 |
1998 |
1997 |
1996 |
1995 |
1994 |
1993 |
| No.
of hospitals |
52
|
44
|
45
|
45
|
48
|
42
|
37
|
37
|
31
|
| No.
of hospital beds |
7,278
|
6,176
|
6,736
|
6,838
|
7,220
|
5,521
|
3,822
|
3,745
|
3,520
|
| Avg.
Beds / Hospital |
139
|
140
|
149
|
151
|
150
|
131
|
103
|
101
|
113
|
| Capita
/ Hospital bed |
219
|
257
|
235
|
231
|
217
|
283
|
408
|
415
|
438
|
| No.
of physicians |
892
|
763
|
841
|
802
|
805
|
765
|
725
|
712
|
662
|
| Capita
/ Physician |
1,794
|
2,084
|
1,887
|
1,972
|
1,954
|
2,045
|
2,154
|
2,185
|
2,331
|
|
No. of dentists |
81
|
204
|
65
|
67
|
62
|
60
|
58
|
73
|
68
|
|
Capita / Dentist |
19,763
|
7,795
|
24,422
|
23,615
|
25,383
|
26,073
|
26,936
|
21,313
|
22,693
|
| No.
of nurses |
3,475
|
2,995
|
3,011
|
2,695
|
2,635
|
2,594
|
2,554
|
2,556
|
2,344
|
|
|
| Education |
2002 |
2000 |
1998 |
1996 |
1994 |
1993 |
| No.
of teachers |
-
|
14,873
|
14,911
|
13,830
|
13,774
|
13,519
|
| No.
of students |
-
|
273,408
|
269,610
|
263,266
|
256,643
|
236,212
|
| No.
of schools |
-
|
1,174
|
1,187
|
1,172
|
1,188
|
1,201
|
| No.
of classrooms |
-
|
11,521
|
11,375
|
11,530
|
11,041
|
10,577
|
| Ratio
: students / teacher |
-
|
18.4
|
18.1
|
19.0
|
18.6
|
17.5
|
| Ratio
: students / classroom |
-
|
23.7
|
23.7
|
22.8
|
23.2
|
22.3
|
|
|
| |
|

