 Nong
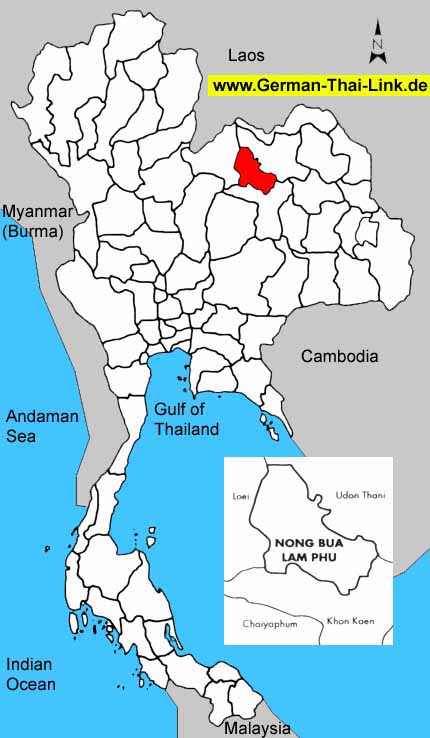
Bua Lamphu is a new province. Nong
Bua Lamphu is a new province. |
| General
Information |
| Area
sq km |
3,859
|
|
|
Anual
rainfall mm (2002) |
-
|
| Forest
Land (1999) |
291
|
7.5 %
|
Days
of rain (2002) |
-
|
| Farm
Land (1999) |
2,416
|
62.6 %
|
Mean
Temperature High/Low (2002) |
-
/
-
|
| Unclassified
Land (1999) |
1,152
|
29.9 %
|
BOI
Zone |
3
|
| Population
/ sq. km (2003) |
129
|
|
Gross
provincial product rank (2001) |
73
|
|
|
| Population |
2003 |
2002 |
2001 |
2000 |
1999 |
1998 |
1997 |
1996 |
| Male |
50.5 %
|
50.4 %
|
50.5 %
|
50.5 %
|
50.6 %
|
50.6 %
|
50.5 %
|
50.6 %
|
| Female |
49.5 %
|
49.6 %
|
49.5 %
|
49.5 %
|
49.4 %
|
49.4 %
|
49.5 %
|
49.4 %
|
| Total |
500,002
|
498,513
|
496,519
|
494,290
|
494,327
|
491,217
|
486,153
|
481,725
|
|
|
| Household
income (baht) |
2002 |
2000 |
1998 |
1996 |
1994 |
| Average
monthly income |
7,326
|
5,532
|
8,386
|
7,147
|
5,430
|
| Average
monthly expenditures |
6,062
|
5,272
|
7,452
|
6,513
|
5,913
|
| Voluntary
reserves |
17.3 %
|
4.7 %
|
11.1 %
|
8.9 %
|
-
|
| Monthly
income / Person |
1,878
|
1,349
|
1,863
|
1,701
|
1,180
|
| Average
household size |
3.9
|
4.1
|
4.5
|
4.2
|
4.6
|
|
|
| Gross
provincial product |
2001 |
2000 |
1999 |
1998 |
1997 |
1996 |
1995 |
1994 |
| Agriculture |
25.2 %
|
25.5 %
|
27.4 %
|
31.0 %
|
28.5 %
|
26.3 %
|
28.0 %
|
25.3 %
|
| Manufacturing |
10.8 %
|
12.2 %
|
11.2 %
|
9.9 %
|
8.8 %
|
7.9 %
|
7.6 %
|
8.2 %
|
| Construction |
3.2 %
|
5.0 %
|
4.9 %
|
4.6 %
|
10.3 %
|
10.8 %
|
8.6 %
|
7.4 %
|
| Transport
& communication |
4.7 %
|
4.2 %
|
4.8 %
|
4.0 %
|
3.9 %
|
3.2 %
|
1.8 %
|
1.9 %
|
| Wholesale
& retail trade |
12.5 %
|
13.7 %
|
9.0 %
|
9.0 %
|
11.0 %
|
9.6 %
|
10.2 %
|
12.4 %
|
| Services |
14.8 %
|
18.7 %
|
20.4 %
|
22.0 %
|
19.4 %
|
26.5 %
|
28.7 %
|
30.7 %
|
| Others |
28.8 %
|
20.7 %
|
22.3 %
|
19.5 %
|
18.1 %
|
15.7 %
|
15.1 %
|
14.1 %
|
|
|
|
|
|
|
|
|
|
| Total
(million baht) |
9,782
|
8,673
|
8,002
|
8,974
|
9,268
|
9,868
|
8,873
|
6,429
|
| GPP
per capita (baht) |
19,701
|
17,546
|
16,187
|
18,268
|
19,063
|
20,484
|
46,107
|
34,465
|
|
|
| Commercial
bank |
2003 |
2002 |
2001 |
2000 |
1999 |
1998 |
1997 |
1996 |
| No.
of offices |
7
|
7
|
7
|
7
|
7
|
7
|
7
|
6
|
| Deposits
(million baht) |
2,776
|
2,631
|
2,624
|
2,250
|
2,460
|
2,459
|
2,374
|
2,271
|
| Loans
(million baht) |
2,419
|
2,162
|
1,815
|
2,181
|
2,371
|
2,371
|
2,664
|
2,527
|
| Deposits
/ capita (baht) |
5,616
|
5,322
|
5,341
|
4,628
|
5,106
|
12,778
|
12,726
|
12,644
|
| Loans/deposits
ratio |
87.1 %
|
82.2 %
|
69.2 %
|
96.9 %
|
96.4 %
|
96.4 %
|
112.2 %
|
111.3 %
|
|
|
| Public
health |
2001 |
2000 |
1999 |
1998 |
1997 |
1996 |
1995 |
1994 |
1993 |
| No.
of hospitals |
6
|
6
|
5
|
5
|
5
|
5
|
5
|
5
|
5
|
| No.
of hospital beds |
468
|
427
|
300
|
315
|
300
|
276
|
246
|
180
|
170
|
| Avg.
Beds / Hospital |
78
|
71
|
60
|
63
|
60
|
55
|
49
|
36
|
34
|
| Capita
/ Hospital bed |
1,060
|
1,157
|
1,647
|
1,559
|
1,620
|
1,745
|
782
|
1,036
|
1,056
|
| No.
of physicians |
35
|
36
|
35
|
31
|
27
|
25
|
23
|
18
|
14
|
| Capita
/ Physician |
14,186
|
13,730
|
14,123
|
15,845
|
18,005
|
19,269
|
8,366
|
10,362
|
12,828
|
|
No. of dentists |
16
|
13
|
13
|
9
|
9
|
8
|
7
|
4
|
2
|
|
Capita / Dentist |
31,032
|
38,022
|
38,025
|
54,579
|
54,017
|
60,215
|
27,491
|
46,633
|
89,799
|
| No.
of nurses |
235
|
156
|
169
|
141
|
117
|
99
|
81
|
78
|
74
|
|
|
| Education |
2002 |
2000 |
1998 |
1996 |
1994 |
1993 |
| No.
of teachers |
-
|
4,393
|
4,256
|
4,230
|
4,034
|
3,825
|
| No.
of students |
-
|
92,643
|
93,206
|
91,897
|
87,556
|
74,521
|
| No.
of schools |
-
|
353
|
352
|
349
|
346
|
339
|
| No.
of classrooms |
-
|
3,984
|
3,950
|
3,916
|
3,528
|
3,154
|
| Ratio
: students / teacher |
-
|
21.1
|
21.9
|
21.7
|
21.7
|
19.5
|
| Ratio
: students / classroom |
-
|
23.3
|
23.6
|
23.5
|
24.8
|
23.6
|
|
|
| |
|

