|
| General
Information |
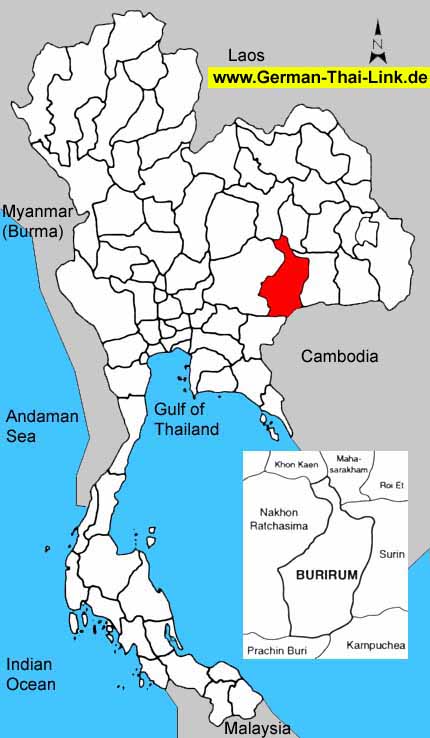
| Area
sq km |
10,232
|
|
|
Anual
rainfall mm (2002) |
1,414
|
| Forest
Land (1999) |
523
|
5.1 %
|
Days
of rain (2002) |
111
|
| Farm
Land (1999) |
6,128
|
59.9 %
|
Mean
Temperature High/Low (2002) |
33.3
/
22.7
|
| Unclassified
Land (1999) |
3,581
|
35.0 %
|
BOI
Zone |
3
|
| Population
/ sq. km (2003) |
151
|
|
Gross
provincial product rank (2001) |
27
|
|
|
| Population |
2003 |
2002 |
2001 |
2000 |
1999 |
1998 |
1997 |
1996 |
| Male |
49.9 %
|
50.0 %
|
49.9 %
|
50.0 %
|
50.0 %
|
50.0 %
|
49.9 %
|
50.0 %
|
| Female |
50.1 %
|
50.0 %
|
50.1 %
|
50.0 %
|
50.0 %
|
50.0 %
|
50.1 %
|
50.0 %
|
| Total |
1,554,009
|
1,545,779
|
1,533,874
|
1,528,207
|
1,520,419
|
1,513,889
|
1,494,836
|
1,476,984
|
|
|
| Household
income (baht) |
2002 |
2000 |
1998 |
1996 |
1994 |
| Average
monthly income |
7,861
|
8,137
|
8,365
|
6,446
|
4,392
|
| Average
monthly expenditures |
6,677
|
6,784
|
6,687
|
6,452
|
4,507
|
| Voluntary
reserves |
15.1 %
|
16.6 %
|
20.1 %
|
-
|
-
|
| Monthly
income / Person |
2,124
|
2,034
|
1,945
|
1,572
|
1,045
|
| Average
household size |
3.7
|
4.0
|
4.3
|
4.1
|
4.2
|
|
|
| Gross
provincial product |
2001 |
2000 |
1999 |
1998 |
1997 |
1996 |
1995 |
1994 |
| Agriculture |
20.8 %
|
20.9 %
|
19.9 %
|
25.7 %
|
23.7 %
|
23.2 %
|
21.9 %
|
21.2 %
|
| Manufacturing |
10.4 %
|
9.6 %
|
12.6 %
|
10.5 %
|
9.8 %
|
9.5 %
|
11.2 %
|
11.2 %
|
| Construction |
2.8 %
|
3.7 %
|
3.7 %
|
4.0 %
|
7.0 %
|
10.2 %
|
10.0 %
|
7.6 %
|
| Transport
& communication |
3.6 %
|
3.2 %
|
3.2 %
|
3.1 %
|
3.1 %
|
3.0 %
|
2.9 %
|
2.9 %
|
| Wholesale
& retail trade |
24.4 %
|
25.0 %
|
23.8 %
|
22.3 %
|
24.0 %
|
23.2 %
|
23.4 %
|
25.0 %
|
| Services |
19.3 %
|
18.6 %
|
17.9 %
|
15.9 %
|
14.5 %
|
13.7 %
|
14.0 %
|
14.5 %
|
| Others |
18.7 %
|
19.0 %
|
18.9 %
|
18.5 %
|
17.9 %
|
17.2 %
|
16.6 %
|
17.6 %
|
|
|
|
|
|
|
|
|
|
| Total
(million baht) |
34,129
|
33,151
|
32,847
|
33,501
|
33,500
|
21,799
|
30,082
|
24,667
|
| GPP
per capita (baht) |
22,250
|
21,692
|
21,603
|
22,129
|
22,410
|
14,759
|
20,373
|
16,876
|
|
|
| Commercial
bank |
2003 |
2002 |
2001 |
2000 |
1999 |
1998 |
1997 |
1996 |
| No.
of offices |
31
|
32
|
32
|
32
|
30
|
30
|
30
|
28
|
| Deposits
(million baht) |
12,851
|
12,120
|
12,122
|
10,469
|
10,863
|
10,863
|
10,311
|
9,869
|
| Loans
(million baht) |
10,944
|
10,615
|
9,095
|
10,965
|
12,320
|
12,320
|
13,933
|
13,758
|
| Deposits
/ capita (baht) |
8,409
|
7,971
|
8,007
|
7,003
|
7,354
|
7,357
|
7,054
|
6,831
|
| Loans/deposits
ratio |
85.2 %
|
87.6 %
|
75.0 %
|
104.7 %
|
113.4 %
|
113.4 %
|
135.1 %
|
139.4 %
|
|
|
| Public
health |
2001 |
2000 |
1999 |
1998 |
1997 |
1996 |
1995 |
1994 |
1993 |
| No.
of hospitals |
24
|
24
|
23
|
23
|
22
|
23
|
24
|
20
|
18
|
| No.
of hospital beds |
1,892
|
1,562
|
1,522
|
1,522
|
1,372
|
1,303
|
1,234
|
1,121
|
1,041
|
| Avg.
Beds / Hospital |
78
|
65
|
66
|
66
|
62
|
56
|
51
|
56
|
57
|
| Capita
/ Hospital bed |
810
|
978
|
998
|
994
|
1,089
|
1,133
|
1,196
|
1,303
|
1,387
|
| No.
of physicians |
135
|
130
|
139
|
130
|
120
|
104
|
88
|
81
|
83
|
| Capita
/ Physician |
11,362
|
11,755
|
10,938
|
11,645
|
12,456
|
14,201
|
16,778
|
18,044
|
17,404
|
|
No. of dentists |
44
|
38
|
33
|
30
|
25
|
22
|
20
|
18
|
16
|
|
Capita / Dentist |
34,860
|
40,215
|
46,073
|
50,462
|
59,793
|
67,135
|
73,824
|
81,200
|
90,286
|
| No.
of nurses |
737
|
691
|
623
|
550
|
529
|
478
|
428
|
394
|
351
|
|
|
| Education |
2002 |
2000 |
1998 |
1996 |
1994 |
1993 |
| No.
of teachers |
-
|
13,637
|
13,583
|
13,634
|
13,406
|
12,805
|
| No.
of students |
-
|
296,047
|
293,382
|
281,364
|
268,247
|
248,605
|
| No.
of schools |
-
|
932
|
931
|
916
|
899
|
898
|
| No.
of classrooms |
-
|
11,379
|
11,196
|
10,988
|
10,675
|
10,231
|
| Ratio
: students / teacher |
-
|
21.7
|
21.6
|
20.6
|
20.0
|
19.4
|
| Ratio
: students / classroom |
-
|
26.0
|
26.2
|
25.6
|
25.1
|
24.3
|
|
|
| |
|

