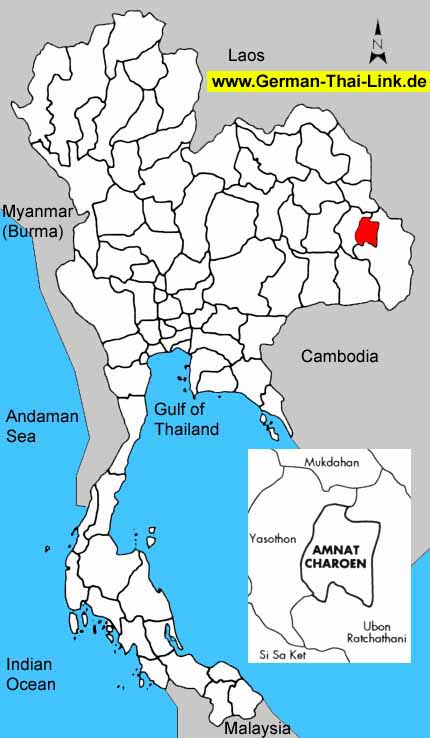
 Amnat Charoen is a new province.
 |
| General
Information |
| Area
sq km |
3,161
|
|
|
Anual
rainfall mm (2002) |
-
|
| Forest
Land (1999) |
1,023
|
32.4 %
|
Days
of rain (2002) |
-
|
| Farm
Land (1999) |
2,135
|
67.5 %
|
Mean
Temperature High/Low (2002) |
-
/
-
|
| Unclassified
Land (1999) |
3
|
0.1 %
|
BOI
Zone |
3
|
| Population
/ sq. km (2003) |
117
|
|
Gross
provincial product rank (2001) |
75
|
|
|
| Population |
2003 |
2002 |
2001 |
2000 |
1999 |
1998 |
1997 |
1996 |
| Male |
50.1 %
|
50.2 %
|
50.2 %
|
50.2 %
|
50.2 %
|
50.3 %
|
50.2 %
|
50.2 %
|
| Female |
49.9 %
|
49.8 %
|
49.8 %
|
49.8 %
|
49.8 %
|
49.7 %
|
49.8 %
|
49.8 %
|
| Total |
370,627
|
370,360
|
368,230
|
366,895
|
365,943
|
364,321
|
360,340
|
357,334
|
|
|
| Household
income (baht) |
2002 |
2000 |
1998 |
1996 |
1994 |
| Average
monthly income |
9,885
|
7,711
|
8,139
|
7,027
|
4,856
|
| Average
monthly expenditures |
7,859
|
6,363
|
7,296
|
6,477
|
5,314
|
| Voluntary
reserves |
20.5 %
|
17.5 %
|
10.4 %
|
7.8 %
|
-
|
| Monthly
income / Person |
2,601
|
1,927
|
1,937
|
1,713
|
1,103
|
| Average
household size |
3.8
|
4.0
|
4.2
|
4.1
|
4.4
|
|
|
| Gross
provincial product |
2001 |
2000 |
1999 |
1998 |
1997 |
1996 |
1995 |
1994 |
| Agriculture |
27.4 %
|
26.5 %
|
26.9 %
|
31.3 %
|
28.4 %
|
27.7 %
|
21.4 %
|
20.8 %
|
| Manufacturing |
8.5 %
|
8.1 %
|
7.4 %
|
6.6 %
|
5.9 %
|
6.2 %
|
5.7 %
|
6.3 %
|
| Construction |
4.2 %
|
5.7 %
|
5.3 %
|
5.3 %
|
14.5 %
|
16.9 %
|
12.1 %
|
8.0 %
|
| Transport
& communication |
3.5 %
|
3.4 %
|
3.3 %
|
3.1 %
|
3.0 %
|
2.2 %
|
2.7 %
|
3.0 %
|
| Wholesale
& retail trade |
19.7 %
|
19.0 %
|
17.2 %
|
12.5 %
|
14.3 %
|
13.8 %
|
12.1 %
|
14.0 %
|
| Services |
15.0 %
|
16.4 %
|
18.2 %
|
21.2 %
|
17.6 %
|
16.9 %
|
32.0 %
|
33.0 %
|
| Others |
21.7 %
|
20.9 %
|
21.7 %
|
20.0 %
|
16.3 %
|
16.3 %
|
14.0 %
|
14.9 %
|
|
|
|
|
|
|
|
|
|
| Total
(million baht) |
7,084
|
7,120
|
6,605
|
6,911
|
7,640
|
7,382
|
7,992
|
6,103
|
| GPP
per capita (baht) |
19,237
|
19,406
|
18,049
|
18,969
|
21,202
|
20,658
|
22,348
|
17,252
|
|
|
| Commercial
bank |
2003 |
2002 |
2001 |
2000 |
1999 |
1998 |
1997 |
1996 |
| No.
of offices |
8
|
8
|
9
|
10
|
9
|
9
|
9
|
9
|
| Deposits
(million baht) |
2,591
|
2,447
|
2,389
|
2,054
|
2,214
|
2,214
|
2,103
|
2,155
|
| Loans
(million baht) |
2,796
|
2,849
|
2,547
|
3,251
|
3,267
|
3,267
|
3,523
|
3,418
|
| Deposits
/ capita (baht) |
7,061
|
6,686
|
6,557
|
5,700
|
6,195
|
6,191
|
5,944
|
6,149
|
| Loans/deposits
ratio |
107.9 %
|
116.4 %
|
106.6 %
|
158.3 %
|
147.6 %
|
147.6 %
|
167.5 %
|
158.6 %
|
|
|
| Public
health |
2001 |
2000 |
1999 |
1998 |
1997 |
1996 |
1995 |
1994 |
1993 |
| No.
of hospitals |
7
|
7
|
7
|
7
|
7
|
6
|
6
|
5
|
5
|
| No.
of hospital beds |
410
|
388
|
398
|
280
|
280
|
240
|
200
|
150
|
100
|
| Avg.
Beds / Hospital |
58
|
55
|
56
|
40
|
40
|
40
|
33
|
30
|
20
|
| Capita
/ Hospital bed |
898
|
945
|
919
|
1,301
|
1,286
|
1,488
|
1,788
|
2,358
|
3,504
|
| No.
of physicians |
58
|
29
|
35
|
36
|
22
|
20
|
19
|
18
|
17
|
| Capita
/ Physician |
6,348
|
12,651
|
10,455
|
10,120
|
16,379
|
17,866
|
18,821
|
19,653
|
20,615
|
|
No. of dentists |
27
|
15
|
14
|
11
|
12
|
9
|
6
|
6
|
5
|
|
Capita / Dentist |
13,638
|
24,459
|
26,138
|
33,120
|
30,028
|
39,703
|
59,600
|
58,959
|
70,091
|
| No.
of nurses |
353
|
210
|
176
|
134
|
118
|
98
|
79
|
68
|
57
|
|
|
| Education |
2002 |
2000 |
1998 |
1996 |
1994 |
1993 |
| No.
of teachers |
-
|
3,403
|
3,318
|
3,180
|
3,019
|
2,890
|
| No.
of students |
-
|
72,585
|
71,793
|
68,537
|
63,847
|
58,555
|
| No.
of schools |
-
|
292
|
292
|
288
|
284
|
282
|
| No.
of classrooms |
-
|
3,048
|
3,006
|
2,964
|
2,652
|
2,249
|
| Ratio
: students / teacher |
-
|
21.3
|
21.6
|
21.6
|
21.1
|
20.3
|
| Ratio
: students / classroom |
-
|
23.8
|
23.9
|
23.1
|
24.1
|
26.0
|
|
|
| |
|

