The province of Rayong is known for its fine beaches, testy food and
delectable durians.
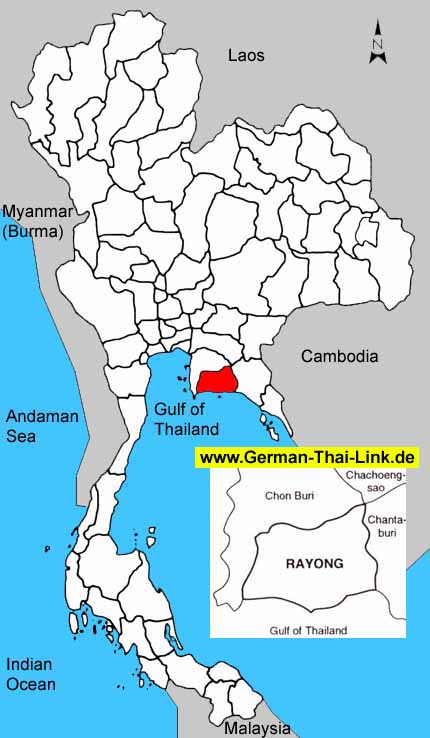
About 220 kilometers from Bangkok on Highway No. 3 or 179 Kilometers
on Highway No.36 with its new short-cut.
The King Taksin Shrine located at Wat Lum Mahachai Chumpon commemorates
the occasion when he was ralling Thai fighters to liberate the country
from Burmese occupation. It is hightly revered by the people, particularly
those of Chinese ancestry, and draws large worshipping crowds during the
chinese New Year celebrations.
The Khao Cha-mao National Park which is about 17 kilometers off the
main highway at Km. 274, abounds with various types of trees and plants,
as well as those species highly valued as decorative plants. Namtok Khao
Cha-mao has 8 levels and is not too difficult to reach the top. About
77 kilometers from town and another 12 kilometers from a left turn at
Km. 286 Sukhumvit Highway is Tham Khao Wong (Cave) Accessibility during
rainy season is rather difficult along the laterite road. There are about
80 big and small connecting chambers, all of which are richly and beautifully
decorated with natural stalactites and stalagmites.
Ko Man which consists of three islands namely Ko Man Nai,Ko Man Klang
and Ko Man Nok, located 5 kms. from Laem Mae Phim. It takes about 30 minutes
by boat. The islands are good for coral reefs, and are going to be developed
into Sea Turtle Preservation Sanctuary.
|
| General
Information |
| Area
sq km |
3,552
|
|
|
Anual
rainfall mm (2002) |
1,146
|
| Forest
Land (1999) |
208
|
5.9 %
|
Days
of rain (2002) |
105
|
| Farm
Land (1999) |
2,042
|
57.5 %
|
Mean
Temperature High/Low (2002) |
34.5
/
25.4
|
| Unclassified
Land (1999) |
1,302
|
36.7 %
|
BOI
Zone |
3
|
| Population
/ sq. km (2003) |
156
|
|
Gross
provincial product rank (2001) |
2
|
|
|
| Population |
2003 |
2002 |
2001 |
2000 |
1999 |
1998 |
1997 |
1996 |
| Male |
49.9 %
|
49.9 %
|
50.0 %
|
50.1 %
|
50.2 %
|
50.4 %
|
50.5 %
|
50.5 %
|
| Female |
50.1 %
|
50.1 %
|
50.0 %
|
49.9 %
|
49.8 %
|
49.6 %
|
49.5 %
|
49.5 %
|
| Total |
556,733
|
546,570
|
536,335
|
523,518
|
513,984
|
515,008
|
504,631
|
490,137
|
|
|
| Household
income (baht) |
2002 |
2000 |
1998 |
1996 |
1994 |
| Average
monthly income |
13,255
|
14,739
|
12,491
|
13,254
|
8,597
|
| Average
monthly expenditures |
9,967
|
10,587
|
11,334
|
11,530
|
8,506
|
| Voluntary
reserves |
24.8 %
|
28.2 %
|
9.3 %
|
13.0 %
|
1.1 %
|
| Monthly
income / Person |
4,016
|
4,466
|
3,469
|
3,898
|
2,388
|
| Average
household size |
3.3
|
3.3
|
3.6
|
3.4
|
3.6
|
|
|
| Gross
provincial product |
2001 |
2000 |
1999 |
1998 |
1997 |
1996 |
1995 |
1994 |
| Agriculture |
2.9 %
|
2.8 %
|
3.7 %
|
6.6 %
|
6.4 %
|
8.3 %
|
12.0 %
|
14.0 %
|
| Manufacturing |
54.7 %
|
55.8 %
|
57.9 %
|
39.0 %
|
31.5 %
|
37.7 %
|
25.8 %
|
27.0 %
|
| Construction |
1.1 %
|
0.6 %
|
0.7 %
|
1.1 %
|
1.4 %
|
3.1 %
|
4.8 %
|
5.4 %
|
| Transport
& communication |
1.7 %
|
1.8 %
|
2.3 %
|
2.9 %
|
4.6 %
|
4.2 %
|
4.3 %
|
3.2 %
|
| Wholesale
& retail trade |
2.1 %
|
2.2 %
|
2.5 %
|
3.4 %
|
4.3 %
|
4.6 %
|
6.3 %
|
6.2 %
|
| Services |
2.3 %
|
2.2 %
|
2.6 %
|
3.4 %
|
3.8 %
|
4.6 %
|
5.2 %
|
4.5 %
|
| Others |
35.2 %
|
34.6 %
|
30.3 %
|
43.6 %
|
48.0 %
|
37.5 %
|
41.6 %
|
39.7 %
|
|
|
|
|
|
|
|
|
|
| Total
(million baht) |
291,193
|
276,261
|
223,247
|
155,799
|
133,547
|
112,409
|
78,075
|
70,549
|
| GPP
per capita (baht) |
542,931
|
527,701
|
434,346
|
302,517
|
264,642
|
229,342
|
164,131
|
153,521
|
|
|
| Commercial
bank |
2003 |
2002 |
2001 |
2000 |
1999 |
1998 |
1997 |
1996 |
| No.
of offices |
50
|
47
|
51
|
57
|
54
|
54
|
54
|
52
|
| Deposits
(million baht) |
36,562
|
35,130
|
33,991
|
32,116
|
34,123
|
34,123
|
33,894
|
32,592
|
| Loans
(million baht) |
22,628
|
23,386
|
20,523
|
24,083
|
25,269
|
25,269
|
29,062
|
28,225
|
| Deposits
/ capita (baht) |
69,839
|
68,348
|
66,000
|
63,642
|
69,619
|
71,734
|
73,756
|
73,476
|
| Loans/deposits
ratio |
61.9 %
|
66.6 %
|
60.4 %
|
75.0 %
|
74.1 %
|
74.1 %
|
85.7 %
|
86.6 %
|
|
|
| Public
health |
2001 |
2000 |
1999 |
1998 |
1997 |
1996 |
1995 |
1994 |
1993 |
| No.
of hospitals |
14
|
16
|
18
|
17
|
14
|
14
|
15
|
13
|
10
|
| No.
of hospital beds |
1,180
|
1,262
|
1,428
|
1,261
|
776
|
859
|
943
|
744
|
625
|
| Avg.
Beds / Hospital |
84
|
78
|
79
|
74
|
55
|
61
|
62
|
57
|
62
|
| Capita
/ Hospital bed |
454
|
414
|
359
|
408
|
650
|
570
|
504
|
617
|
709
|
| No.
of physicians |
128
|
160
|
135
|
111
|
84
|
100
|
117
|
101
|
74
|
| Capita
/ Physician |
4,190
|
3,271
|
3,807
|
4,639
|
6,007
|
4,901
|
4,065
|
4,549
|
5,994
|
|
No. of dentists |
25
|
20
|
18
|
19
|
14
|
16
|
18
|
16
|
13
|
|
Capita / Dentist |
21,453
|
26,175
|
28,554
|
27,105
|
36,045
|
30,633
|
26,426
|
28,721
|
34,120
|
| No.
of nurses |
596
|
677
|
608
|
533
|
451
|
453
|
456
|
410
|
295
|
|
|
| Education |
2002 |
2000 |
1998 |
1996 |
1994 |
1993 |
| No.
of teachers |
-
|
4,895
|
4,832
|
4,787
|
4,486
|
4,526
|
| No.
of students |
-
|
108,579
|
104,087
|
99,331
|
91,663
|
88,636
|
| No.
of schools |
-
|
270
|
274
|
275
|
274
|
269
|
| No.
of classrooms |
-
|
3,398
|
3,410
|
3,398
|
3,269
|
3,135
|
| Ratio
: students / teacher |
-
|
22.2
|
21.5
|
20.8
|
20.4
|
19.6
|
| Ratio
: students / classroom |
-
|
32.0
|
30.5
|
29.2
|
28.0
|
28.3
|
|
|
| |
|

