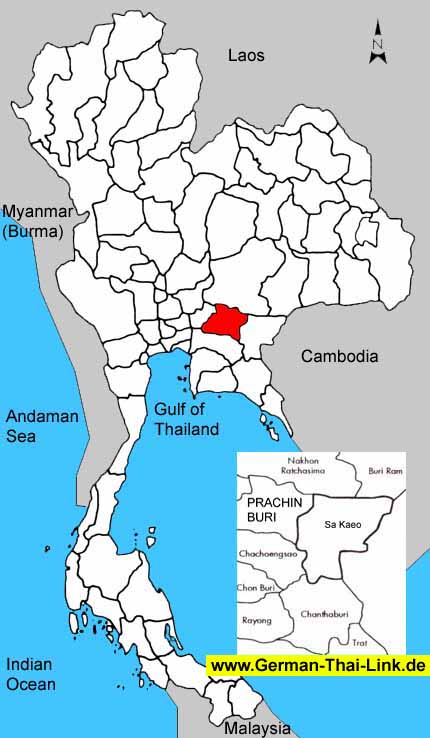
Prachin Buri is an eastern province located some 134 kilometers from
Bangkok In 1997 the western part was split and called Sa Kaeo.Please keep
this in mind, when you have a closer look at the numbers below.
Wat Kaeo Phichit This very old important monastery having an unknown
date of construction is located on the bank of Bang Pakong River in the
vicinity of the township. The unusual characteristic of this monastery
is the combination between the Greek and Thai arts, and the mural paintings
inside the Ubosot are very beautiful.
Lan National Park This park is in the vicinity of Amphoe Na Di on Highway
No. 304, about 30 kilometers beyond the Kabin Buri Intersection. It was
established as a National Park on December 23, 1981, occupying an approximate
area of 2,240 square kilometers or 1,400,000 rai. The plants mostly found
are of the palm family.
Pang Sida National Park It was established through the announcement in
the Government Gazette as a National Park on February 24, 1982 occupying
an approximate area of 844 square kilometers or 527,500 rai. To access
the park, one can travel from Amphoe Sa Kaeo Market through a branch road
on the left for a distance of 27 kilometers.
Prachin Buri National Museum This museum, located 200 m. southeast of
the City Hall, puts on display the artifacts discovered within Prachin
Buri Province and its nearby area. Also exhibited are ancient sculptures
of very style and period with an aim to educate the visitors on Thai art
history. Underwater archaeology in the Gulf of Thailand as well as artifacts
found off the coast of Amphoe Sattahip, Chon Buri Province are also on
exhibition.
|
| General
Information |
| Area
sq km |
4,762
|
|
|
Anual
rainfall mm (2002) |
1,775
|
| Forest
Land (1999) |
1,591
|
33.4 %
|
Days
of rain (2002) |
127
|
| Farm
Land (1999) |
1,968
|
41.3 %
|
Mean
Temperature High/Low (2002) |
34.4
/
23.7
|
| Unclassified
Land (1999) |
1,203
|
25.3 %
|
BOI
Zone |
3
|
| Population
/ sq. km (2003) |
95
|
|
Gross
provincial product rank (2001) |
33
|
|
|
| Population |
2003 |
2002 |
2001 |
2000 |
1999 |
1998 |
1997 |
1996 |
| Male |
50.2 %
|
50.1 %
|
50.1 %
|
50.1 %
|
50.2 %
|
50.3 %
|
52.7 %
|
50.4 %
|
| Female |
49.8 %
|
49.9 %
|
49.9 %
|
49.9 %
|
49.8 %
|
49.7 %
|
47.3 %
|
49.6 %
|
| Total |
453,935
|
452,822
|
448,476
|
444,190
|
441,162
|
441,343
|
436,956
|
432,251
|
|
|
| Household
income (baht) |
2002 |
2000 |
1998 |
1996 |
1994 |
| Average
monthly income |
12,720
|
10,477
|
9,852
|
8,117
|
6,238
|
| Average
monthly expenditures |
11,100
|
9,696
|
8,692
|
6,110
|
4,845
|
| Voluntary
reserves |
12.7 %
|
7.5 %
|
11.8 %
|
24.7 %
|
22.3 %
|
| Monthly
income / Person |
3,437
|
2,831
|
2,592
|
2,136
|
1,732
|
| Average
household size |
3.7
|
3.7
|
3.8
|
3.8
|
3.6
|
|
|
| Gross
provincial product |
2001 |
2000 |
1999 |
1998 |
1997 |
1996 |
1995 |
1994 |
| Agriculture |
15.3 %
|
12.5 %
|
15.8 %
|
17.5 %
|
12.9 %
|
13.2 %
|
13.3 %
|
16.9 %
|
| Manufacturing |
29.0 %
|
29.8 %
|
28.7 %
|
29.5 %
|
27.0 %
|
26.7 %
|
24.6 %
|
23.2 %
|
| Construction |
1.5 %
|
2.8 %
|
4.0 %
|
3.1 %
|
6.3 %
|
7.7 %
|
8.0 %
|
6.9 %
|
| Transport
& communication |
2.4 %
|
2.1 %
|
2.3 %
|
2.7 %
|
2.6 %
|
2.7 %
|
3.0 %
|
3.1 %
|
| Wholesale
& retail trade |
28.1 %
|
28.7 %
|
25.6 %
|
22.2 %
|
27.5 %
|
24.9 %
|
26.0 %
|
23.9 %
|
| Services |
8.7 %
|
9.3 %
|
9.2 %
|
9.7 %
|
9.0 %
|
9.6 %
|
9.6 %
|
9.1 %
|
| Others |
15.0 %
|
14.8 %
|
14.4 %
|
15.3 %
|
14.7 %
|
15.2 %
|
15.5 %
|
16.9 %
|
|
|
|
|
|
|
|
|
|
| Total
(million baht) |
30,384
|
30,282
|
29,131
|
26,882
|
27,360
|
25,624
|
22,223
|
18,836
|
| GPP
per capita (baht) |
67,749
|
68,173
|
66,032
|
60,909
|
62,615
|
59,280
|
51,532
|
44,154
|
|
|
| Commercial
bank |
2003 |
2002 |
2001 |
2000 |
1999 |
1998 |
1997 |
1996 |
| No.
of offices |
19
|
19
|
19
|
19
|
18
|
18
|
18
|
18
|
| Deposits
(million baht) |
10,182
|
9,822
|
9,960
|
8,875
|
9,313
|
9,313
|
9,168
|
8,701
|
| Loans
(million baht) |
7,218
|
7,287
|
6,928
|
6,746
|
7,166
|
7,166
|
7,974
|
7,760
|
| Deposits
/ capita (baht) |
22,922
|
22,263
|
22,567
|
20,310
|
21,545
|
21,595
|
21,491
|
20,769
|
| Loans/deposits
ratio |
70.9 %
|
74.2 %
|
69.6 %
|
76.0 %
|
76.9 %
|
76.9 %
|
87.0 %
|
89.2 %
|
|
|
| Public
health |
2001 |
2000 |
1999 |
1998 |
1997 |
1996 |
1995 |
1994 |
1993 |
| No.
of hospitals |
11
|
9
|
9
|
9
|
12
|
11
|
11
|
11
|
17
|
| No.
of hospital beds |
1,033
|
958
|
927
|
927
|
996
|
970
|
944
|
805
|
1,135
|
| Avg.
Beds / Hospital |
93
|
106
|
103
|
103
|
83
|
88
|
85
|
73
|
66
|
| Capita
/ Hospital bed |
434
|
463
|
475
|
476
|
438
|
445
|
456
|
529
|
369
|
| No.
of physicians |
106
|
99
|
92
|
72
|
59
|
68
|
78
|
76
|
93
|
| Capita
/ Physician |
4,230
|
4,486
|
4,795
|
6,129
|
7,406
|
6,356
|
5,528
|
5,613
|
4,504
|
|
No. of dentists |
22
|
23
|
29
|
29
|
19
|
22
|
25
|
26
|
24
|
|
Capita / Dentist |
20,385
|
19,312
|
15,212
|
15,218
|
22,997
|
19,647
|
17,249
|
16,407
|
17,455
|
| No.
of nurses |
429
|
423
|
416
|
382
|
349
|
340
|
332
|
321
|
371
|
|
|
| Education |
2002 |
2000 |
1998 |
1996 |
1994 |
1993 |
| No.
of teachers |
-
|
4,457
|
4,365
|
4,252
|
4,099
|
4,124
|
| No.
of students |
-
|
88,647
|
86,573
|
82,322
|
79,046
|
82,056
|
| No.
of schools |
-
|
320
|
329
|
341
|
350
|
340
|
| No.
of classrooms |
-
|
3,246
|
3,364
|
3,453
|
3,232
|
3,342
|
| Ratio
: students / teacher |
-
|
19.9
|
19.8
|
19.4
|
19.3
|
19.9
|
| Ratio
: students / classroom |
-
|
27.3
|
25.7
|
23.8
|
24.5
|
24.6
|
|
|
| |
|

