|
| General
Information |
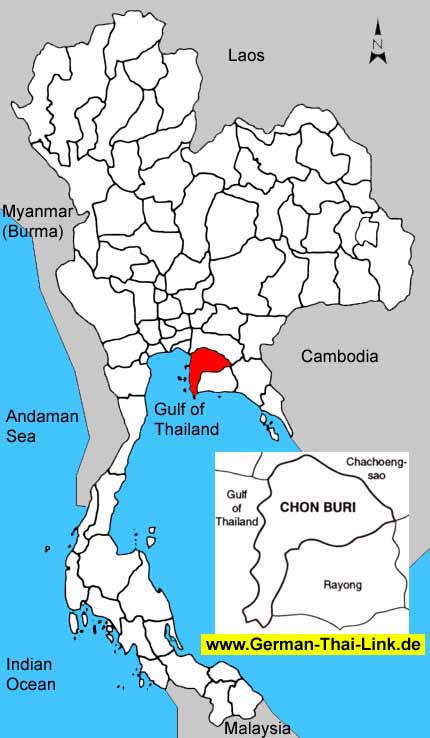
| Area
sq km |
4,363
|
|
|
Anual
rainfall mm (2002) |
1,111
|
| Forest
Land (1999) |
240
|
5.5 %
|
Days
of rain (2002) |
122
|
| Farm
Land (1999) |
2,096
|
48.0 %
|
Mean
Temperature High/Low (2002) |
33.4
/
25.6
|
| Unclassified
Land (1999) |
2,027
|
46.5 %
|
BOI
Zone |
2
|
| Population
/ sq. km (2003) |
265
|
|
Gross
provincial product rank (2001) |
3
|
|
|
| Population |
2003 |
2002 |
2001 |
2000 |
1999 |
1998 |
1997 |
1996 |
| Male |
50.0 %
|
50.1 %
|
50.3 %
|
50.3 %
|
50.4 %
|
50.6 %
|
50.9 %
|
51.1 %
|
| Female |
50.0 %
|
49.9 %
|
49.7 %
|
49.7 %
|
49.6 %
|
49.4 %
|
49.1 %
|
48.9 %
|
| Total |
1,157,111
|
1,129,886
|
1,104,231
|
1,078,518
|
1,059,759
|
1,053,433
|
1,028,625
|
1,009,041
|
|
|
| Household
income (baht) |
2002 |
2000 |
1998 |
1996 |
1994 |
| Average
monthly income |
16,797
|
13,807
|
14,075
|
12,223
|
10,026
|
| Average
monthly expenditures |
13,635
|
12,353
|
13,070
|
11,107
|
8,293
|
| Voluntary
reserves |
18.8 %
|
10.5 %
|
7.1 %
|
9.1 %
|
17.3 %
|
| Monthly
income / Person |
5,090
|
4,602
|
4,139
|
3,492
|
2,785
|
| Average
household size |
3.3
|
3.0
|
3.4
|
3.5
|
3.6
|
|
|
| Gross
provincial product |
2001 |
2000 |
1999 |
1998 |
1997 |
1996 |
1995 |
1994 |
| Agriculture |
4.9 %
|
3.9 %
|
4.8 %
|
4.2 %
|
3.5 %
|
3.9 %
|
3.8 %
|
3.7 %
|
| Manufacturing |
54.1 %
|
57.7 %
|
55.5 %
|
64.7 %
|
62.1 %
|
62.7 %
|
63.4 %
|
60.5 %
|
| Construction |
2.9 %
|
2.9 %
|
3.0 %
|
2.0 %
|
3.6 %
|
4.5 %
|
4.8 %
|
6.7 %
|
| Transport
& communication |
10.4 %
|
8.2 %
|
8.5 %
|
4.7 %
|
5.5 %
|
4.5 %
|
4.1 %
|
4.1 %
|
| Wholesale
& retail trade |
6.0 %
|
8.4 %
|
8.4 %
|
7.4 %
|
8.0 %
|
7.5 %
|
7.4 %
|
7.5 %
|
| Services |
10.0 %
|
10.2 %
|
10.3 %
|
8.8 %
|
9.0 %
|
9.6 %
|
9.2 %
|
9.8 %
|
| Others |
11.7 %
|
8.7 %
|
9.5 %
|
8.2 %
|
8.3 %
|
7.3 %
|
7.3 %
|
7.7 %
|
|
|
|
|
|
|
|
|
|
| Total
(million baht) |
260,656
|
242,769
|
221,297
|
229,620
|
220,530
|
208,047
|
190,409
|
159,935
|
| GPP
per capita (baht) |
236,052
|
225,094
|
208,818
|
217,973
|
214,393
|
206,182
|
189,340
|
162,566
|
|
|
| Commercial
bank |
2003 |
2002 |
2001 |
2000 |
1999 |
1998 |
1997 |
1996 |
| No.
of offices |
126
|
125
|
126
|
137
|
112
|
112
|
111
|
108
|
| Deposits
(million baht) |
121,188
|
114,614
|
112,394
|
101,577
|
103,429
|
103,429
|
97,588
|
89,480
|
| Loans
(million baht) |
74,364
|
67,349
|
62,207
|
68,234
|
76,014
|
76,014
|
77,460
|
79,469
|
| Deposits
/ capita (baht) |
112,365
|
108,151
|
106,693
|
98,750
|
102,502
|
102,848
|
99,193
|
92,401
|
| Loans/deposits
ratio |
61.4 %
|
58.8 %
|
55.3 %
|
67.2 %
|
73.5 %
|
73.5 %
|
79.4 %
|
88.8 %
|
|
|
| Public
health |
2001 |
2000 |
1999 |
1998 |
1997 |
1996 |
1995 |
1994 |
1993 |
| No.
of hospitals |
30
|
30
|
31
|
32
|
37
|
34
|
31
|
28
|
25
|
| No.
of hospital beds |
3,866
|
3,739
|
3,593
|
3,693
|
4,180
|
3,752
|
3,324
|
2,760
|
2,501
|
| Avg.
Beds / Hospital |
128
|
124
|
115
|
115
|
112
|
110
|
107
|
98
|
100
|
| Capita
/ Hospital bed |
285
|
288
|
294
|
285
|
246
|
268
|
302
|
356
|
387
|
| No.
of physicians |
609
|
570
|
474
|
449
|
473
|
430
|
387
|
342
|
314
|
| Capita
/ Physician |
1,813
|
1,892
|
2,235
|
2,346
|
2,174
|
2,346
|
2,598
|
2,876
|
3,084
|
|
No. of dentists |
103
|
104
|
93
|
87
|
99
|
90
|
82
|
68
|
65
|
|
Capita / Dentist |
10,720
|
10,370
|
11,395
|
12,108
|
10,390
|
11,211
|
12,263
|
14,467
|
14,898
|
| No.
of nurses |
2,428
|
2,145
|
1,758
|
1,716
|
1,708
|
1,479
|
1,251
|
1,442
|
1,355
|
|
|
| Education |
2002 |
2000 |
1998 |
1996 |
1994 |
1993 |
| No.
of teachers |
-
|
9,956
|
9,700
|
9,145
|
9,017
|
8,745
|
| No.
of students |
-
|
219,394
|
206,697
|
197,052
|
187,441
|
182,014
|
| No.
of schools |
-
|
479
|
483
|
477
|
468
|
468
|
| No.
of classrooms |
-
|
6,768
|
6,684
|
6,558
|
7,082
|
6,149
|
| Ratio
: students / teacher |
-
|
22.0
|
21.3
|
21.5
|
20.8
|
20.8
|
| Ratio
: students / classroom |
-
|
32.4
|
30.9
|
30.0
|
26.5
|
29.6
|
|
|
| |
|

