|
| General
Information |
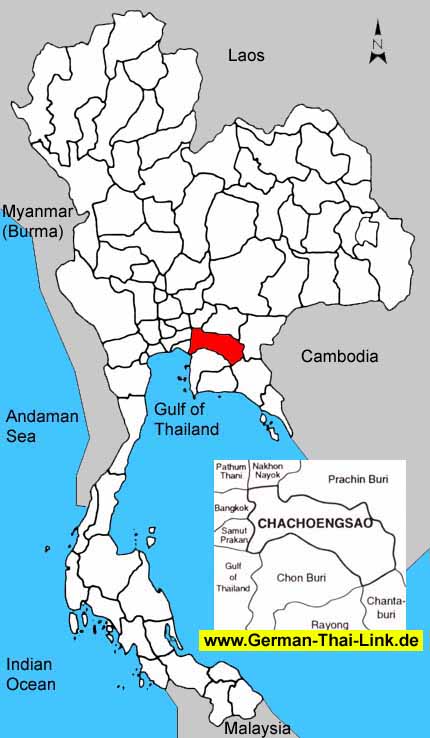
| Area
sq km |
5,351
|
|
|
Anual
rainfall mm (2002) |
-
|
| Forest
Land (1999) |
1,151
|
21.5 %
|
Days
of rain (2002) |
-
|
| Farm
Land (1999) |
2,859
|
53.4 %
|
Mean
Temperature High/Low (2002) |
-
/
-
|
| Unclassified
Land (1999) |
1,341
|
25.1 %
|
BOI
Zone |
2
|
| Population
/ sq. km (2003) |
121
|
|
Gross
provincial product rank (2001) |
17
|
|
|
| Population |
2003 |
2002 |
2001 |
2000 |
1999 |
1998 |
1997 |
1996 |
| Male |
49.3 %
|
49.3 %
|
49.3 %
|
49.4 %
|
49.5 %
|
49.6 %
|
49.6 %
|
49.4 %
|
| Female |
50.7 %
|
50.7 %
|
50.7 %
|
50.6 %
|
50.5 %
|
50.4 %
|
50.4 %
|
50.6 %
|
| Total |
652,501
|
649,758
|
643,996
|
639,751
|
637,665
|
636,323
|
627,119
|
624,875
|
|
|
| Household
income (baht) |
2002 |
2000 |
1998 |
1996 |
1994 |
| Average
monthly income |
14,829
|
13,781
|
14,010
|
11,820
|
11,201
|
| Average
monthly expenditures |
13,157
|
12,735
|
13,308
|
12,356
|
10,854
|
| Voluntary
reserves |
11.3 %
|
7.6 %
|
5.0 %
|
-
|
3.1 %
|
| Monthly
income / Person |
3,902
|
3,533
|
3,686
|
3,030
|
3,027
|
| Average
household size |
3.8
|
3.9
|
3.8
|
3.9
|
3.7
|
|
|
| Gross
provincial product |
2001 |
2000 |
1999 |
1998 |
1997 |
1996 |
1995 |
1994 |
| Agriculture |
14.3 %
|
13.3 %
|
15.4 %
|
18.8 %
|
14.2 %
|
13.9 %
|
15.3 %
|
14.4 %
|
| Manufacturing |
48.4 %
|
49.4 %
|
46.3 %
|
43.5 %
|
43.6 %
|
46.5 %
|
48.5 %
|
49.8 %
|
| Construction |
4.5 %
|
2.4 %
|
3.0 %
|
2.8 %
|
6.5 %
|
4.6 %
|
3.0 %
|
2.7 %
|
| Transport
& communication |
3.8 %
|
3.9 %
|
4.1 %
|
4.8 %
|
6.4 %
|
5.9 %
|
5.2 %
|
4.7 %
|
| Wholesale
& retail trade |
9.7 %
|
10.8 %
|
11.2 %
|
10.5 %
|
10.3 %
|
8.7 %
|
8.5 %
|
9.1 %
|
| Services |
7.8 %
|
7.9 %
|
7.8 %
|
7.0 %
|
6.2 %
|
5.7 %
|
5.3 %
|
5.8 %
|
| Others |
11.5 %
|
12.3 %
|
12.2 %
|
12.6 %
|
12.8 %
|
14.7 %
|
14.2 %
|
13.5 %
|
|
|
|
|
|
|
|
|
|
| Total
(million baht) |
60,356
|
56,063
|
54,473
|
53,272
|
54,664
|
55,274
|
50,595
|
42,818
|
| GPP
per capita (baht) |
93,721
|
87,632
|
85,425
|
83,718
|
87,166
|
88,456
|
81,856
|
69,897
|
|
|
| Commercial
bank |
2003 |
2002 |
2001 |
2000 |
1999 |
1998 |
1997 |
1996 |
| No.
of offices |
47
|
47
|
47
|
52
|
44
|
44
|
43
|
43
|
| Deposits
(million baht) |
33,189
|
32,521
|
33,817
|
33,402
|
35,484
|
35,484
|
34,534
|
33,518
|
| Loans
(million baht) |
17,740
|
16,405
|
15,440
|
19,360
|
21,001
|
21,001
|
21,607
|
20,440
|
| Deposits
/ capita (baht) |
51,877
|
51,000
|
53,144
|
53,262
|
56,785
|
57,408
|
56,374
|
55,275
|
| Loans/deposits
ratio |
53.5 %
|
50.4 %
|
45.7 %
|
58.0 %
|
59.2 %
|
59.2 %
|
62.6 %
|
61.0 %
|
|
|
| Public
health |
2001 |
2000 |
1999 |
1998 |
1997 |
1996 |
1995 |
1994 |
1993 |
| No.
of hospitals |
13
|
13
|
12
|
12
|
15
|
15
|
15
|
14
|
13
|
| No.
of hospital beds |
1,138
|
1,094
|
848
|
818
|
955
|
890
|
826
|
646
|
616
|
| Avg.
Beds / Hospital |
87
|
84
|
70
|
68
|
63
|
59
|
55
|
46
|
47
|
| Capita
/ Hospital bed |
565
|
584
|
751
|
777
|
656
|
702
|
748
|
948
|
984
|
| No.
of physicians |
108
|
157
|
89
|
107
|
92
|
87
|
83
|
76
|
68
|
| Capita
/ Physician |
5,962
|
4,074
|
7,164
|
5,946
|
6,816
|
7,182
|
7,446
|
8,060
|
8,917
|
|
No. of dentists |
25
|
26
|
22
|
29
|
22
|
22
|
22
|
20
|
17
|
|
Capita / Dentist |
25,759
|
24,605
|
28,984
|
21,942
|
28,505
|
28,403
|
28,095
|
30,629
|
35,669
|
| No.
of nurses |
610
|
532
|
504
|
468
|
434
|
393
|
352
|
305
|
302
|
|
|
| Education |
2002 |
2000 |
1998 |
1996 |
1994 |
1993 |
| No.
of teachers |
-
|
6,021
|
6,062
|
5,789
|
5,673
|
5,515
|
| No.
of students |
-
|
125,814
|
121,218
|
114,519
|
110,259
|
103,327
|
| No.
of schools |
-
|
384
|
386
|
390
|
385
|
386
|
| No.
of classrooms |
-
|
4,366
|
4,411
|
4,354
|
4,157
|
4,081
|
| Ratio
: students / teacher |
-
|
20.9
|
20.0
|
19.8
|
19.4
|
18.7
|
| Ratio
: students / classroom |
-
|
28.8
|
27.5
|
26.3
|
26.5
|
25.3
|
|
|
| |
|

