|
| General
Information |
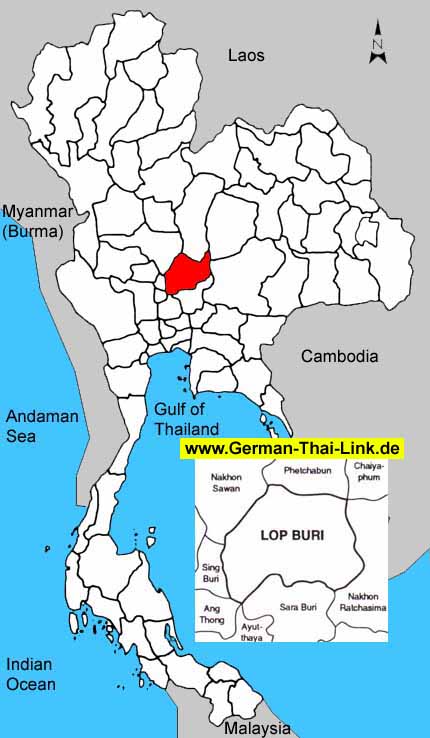
| Area
sq km |
6,200
|
|
|
Anual
rainfall mm (2002) |
1,091
|
| Forest
Land (1999) |
190
|
3.1 %
|
Days
of rain (2002) |
108
|
| Farm
Land (1999) |
3,552
|
57.3 %
|
Mean
Temperature High/Low (2002) |
33.8
/
24.6
|
| Unclassified
Land (1999) |
2,458
|
39.6 %
|
BOI
Zone |
3
|
| Population
/ sq. km (2003) |
123
|
|
Gross
provincial product rank (2001) |
25
|
|
|
| Population |
2003 |
2002 |
2001 |
2000 |
1999 |
1998 |
1997 |
1996 |
| Male |
50.6 %
|
50.6 %
|
50.7 %
|
50.7 %
|
50.8 %
|
51.4 %
|
50.8 %
|
50.9 %
|
| Female |
49.4 %
|
49.4 %
|
49.3 %
|
49.3 %
|
49.2 %
|
48.6 %
|
49.2 %
|
49.1 %
|
| Total |
768,516
|
767,985
|
765,133
|
761,467
|
760,854
|
749,446
|
756,484
|
749,487
|
|
|
| Household
income (baht) |
2002 |
2000 |
1998 |
1996 |
1994 |
| Average
monthly income |
11,010
|
10,649
|
10,587
|
9,331
|
6,612
|
| Average
monthly expenditures |
8,826
|
9,023
|
9,299
|
6,848
|
5,036
|
| Voluntary
reserves |
19.8 %
|
15.3 %
|
12.2 %
|
26.6 %
|
23.8 %
|
| Monthly
income / Person |
3,336
|
3,132
|
3,024
|
2,521
|
1,740
|
| Average
household size |
3.3
|
3.4
|
3.5
|
3.7
|
3.8
|
|
|
| Gross
provincial product |
2001 |
2000 |
1999 |
1998 |
1997 |
1996 |
1995 |
1994 |
| Agriculture |
21.1 %
|
19.4 %
|
18.9 %
|
21.1 %
|
17.1 %
|
17.3 %
|
18.3 %
|
17.1 %
|
| Manufacturing |
10.0 %
|
10.0 %
|
9.2 %
|
9.2 %
|
7.7 %
|
7.1 %
|
8.5 %
|
8.1 %
|
| Construction |
4.7 %
|
5.2 %
|
8.6 %
|
10.5 %
|
22.7 %
|
22.5 %
|
13.5 %
|
10.3 %
|
| Transport
& communication |
4.7 %
|
4.6 %
|
4.9 %
|
5.0 %
|
4.5 %
|
4.4 %
|
5.0 %
|
5.9 %
|
| Wholesale
& retail trade |
19.6 %
|
21.6 %
|
20.3 %
|
19.7 %
|
19.1 %
|
18.3 %
|
21.2 %
|
22.5 %
|
| Services |
14.6 %
|
14.1 %
|
13.4 %
|
10.8 %
|
8.7 %
|
8.4 %
|
9.2 %
|
10.2 %
|
| Others |
25.3 %
|
25.1 %
|
24.7 %
|
23.7 %
|
20.2 %
|
22.0 %
|
24.3 %
|
25.9 %
|
|
|
|
|
|
|
|
|
|
| Total
(million baht) |
35,016
|
34,021
|
34,289
|
33,910
|
37,918
|
36,359
|
30,052
|
24,958
|
| GPP
per capita (baht) |
45,764
|
44,678
|
45,066
|
45,246
|
50,123
|
48,511
|
40,422
|
33,554
|
|
|
| Commercial
bank |
2003 |
2002 |
2001 |
2000 |
1999 |
1998 |
1997 |
1996 |
| No.
of offices |
35
|
34
|
34
|
35
|
29
|
29
|
31
|
30
|
| Deposits
(million baht) |
20,537
|
19,808
|
20,022
|
18,623
|
20,626
|
20,626
|
20,336
|
18,686
|
| Loans
(million baht) |
12,470
|
12,187
|
9,554
|
10,816
|
12,944
|
12,944
|
15,166
|
15,637
|
| Deposits
/ capita (baht) |
26,970
|
26,033
|
26,715
|
24,617
|
27,520
|
27,743
|
27,340
|
25,301
|
| Loans/deposits
ratio |
60.7 %
|
61.5 %
|
47.7 %
|
58.1 %
|
62.8 %
|
62.8 %
|
74.6 %
|
83.7 %
|
|
|
| Public
health |
2001 |
2000 |
1999 |
1998 |
1997 |
1996 |
1995 |
1994 |
1993 |
| No.
of hospitals |
17
|
16
|
15
|
15
|
14
|
14
|
15
|
15
|
15
|
| No.
of hospital beds |
1,840
|
1,778
|
1,588
|
1,548
|
1,413
|
1,410
|
1,407
|
1,347
|
1,347
|
| Avg.
Beds / Hospital |
108
|
111
|
105
|
103
|
100
|
100
|
93
|
89
|
89
|
| Capita
/ Hospital bed |
415
|
428
|
479
|
484
|
535
|
531
|
528
|
552
|
548
|
| No.
of physicians |
174
|
157
|
161
|
107
|
124
|
118
|
113
|
110
|
110
|
| Capita
/ Physician |
4,397
|
4,850
|
4,725
|
7,004
|
6,100
|
6,351
|
6,579
|
6,761
|
6,713
|
|
No. of dentists |
33
|
39
|
39
|
41
|
28
|
29
|
31
|
32
|
32
|
|
Capita / Dentist |
23,185
|
19,524
|
19,509
|
18,279
|
27,017
|
25,844
|
23,982
|
23,243
|
23,079
|
| No.
of nurses |
840
|
810
|
753
|
600
|
714
|
629
|
544
|
237
|
254
|
|
|
| Education |
2002 |
2000 |
1998 |
1996 |
1994 |
1993 |
| No.
of teachers |
-
|
7,367
|
7,258
|
6,920
|
6,994
|
6,828
|
| No.
of students |
-
|
132,891
|
129,189
|
124,012
|
123,137
|
117,313
|
| No.
of schools |
-
|
468
|
472
|
487
|
491
|
496
|
| No.
of classrooms |
-
|
5,123
|
5,286
|
5,329
|
5,157
|
5,033
|
| Ratio
: students / teacher |
-
|
18.0
|
17.8
|
17.9
|
17.6
|
17.2
|
| Ratio
: students / classroom |
-
|
25.9
|
24.4
|
23.3
|
23.9
|
23.3
|
|
|
| |
|

