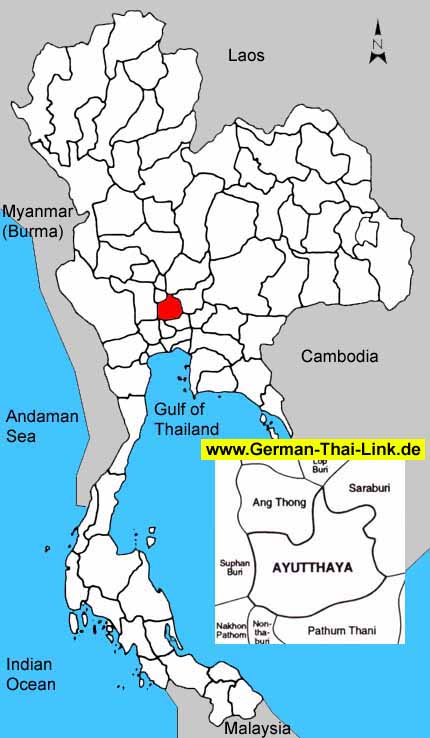
|
| General
Information |
| Area
sq km |
2,557
|
|
|
Anual
rainfall mm (2002) |
-
|
| Forest
Land (1999) |
-
|
-
|
Days
of rain (2002) |
-
|
| Farm
Land (1999) |
1,734
|
67.8 %
|
Mean
Temperature High/Low (2002) |
-
/
-
|
| Unclassified
Land (1999) |
823
|
32.2 %
|
BOI
Zone |
2
|
| Population
/ sq. km (2003) |
293
|
|
Gross
provincial product rank (2001) |
8
|
|
|
| Population |
2003 |
2002 |
2001 |
2000 |
1999 |
1998 |
1997 |
1996 |
| Male |
48.7 %
|
48.7 %
|
48.7 %
|
48.7 %
|
48.8 %
|
48.8 %
|
48.8 %
|
48.8 %
|
| Female |
51.3 %
|
51.3 %
|
51.3 %
|
51.3 %
|
51.2 %
|
51.2 %
|
51.2 %
|
51.2 %
|
| Total |
751,259
|
748,243
|
741,774
|
734,011
|
730,391
|
730,740
|
721,498
|
714,656
|
|
|
| Household
income (baht) |
2002 |
2000 |
1998 |
1996 |
1994 |
| Average
monthly income |
13,319
|
14,904
|
12,918
|
11,376
|
9,953
|
| Average
monthly expenditures |
11,335
|
11,924
|
11,942
|
10,188
|
7,942
|
| Voluntary
reserves |
14.9 %
|
20.0 %
|
7.6 %
|
10.4 %
|
20.2 %
|
| Monthly
income / Person |
3,917
|
4,383
|
3,399
|
3,074
|
2,488
|
| Average
household size |
3.4
|
3.4
|
3.8
|
3.7
|
4.0
|
|
|
| Gross
provincial product |
2001 |
2000 |
1999 |
1998 |
1997 |
1996 |
1995 |
1994 |
| Agriculture |
5.3 %
|
4.7 %
|
5.1 %
|
6.6 %
|
5.8 %
|
5.7 %
|
5.8 %
|
5.7 %
|
| Manufacturing |
58.5 %
|
58.2 %
|
58.6 %
|
54.7 %
|
55.7 %
|
57.4 %
|
57.7 %
|
58.0 %
|
| Construction |
3.1 %
|
2.6 %
|
3.1 %
|
3.2 %
|
4.4 %
|
3.7 %
|
3.2 %
|
3.0 %
|
| Transport
& communication |
3.9 %
|
3.8 %
|
4.0 %
|
4.0 %
|
4.0 %
|
3.6 %
|
3.2 %
|
3.3 %
|
| Wholesale
& retail trade |
8.3 %
|
9.9 %
|
8.1 %
|
9.9 %
|
10.4 %
|
10.3 %
|
10.9 %
|
11.2 %
|
| Services |
10.4 %
|
9.8 %
|
9.3 %
|
8.2 %
|
7.6 %
|
12.1 %
|
7.7 %
|
7.0 %
|
| Others |
10.5 %
|
11.0 %
|
11.8 %
|
13.4 %
|
12.1 %
|
7.2 %
|
11.5 %
|
11.8 %
|
|
|
|
|
|
|
|
|
|
| Total
(million baht) |
88,185
|
82,875
|
74,871
|
73,016
|
74,167
|
68,252
|
61,044
|
51,946
|
| GPP
per capita (baht) |
118,883
|
112,907
|
102,508
|
99,920
|
102,795
|
95,503
|
85,442
|
73,499
|
|
|
| Commercial
bank |
2003 |
2002 |
2001 |
2000 |
1999 |
1998 |
1997 |
1996 |
| No.
of offices |
57
|
54
|
57
|
62
|
54
|
54
|
53
|
48
|
| Deposits
(million baht) |
40,269
|
38,246
|
37,531
|
34,695
|
36,588
|
36,588
|
34,833
|
32,136
|
| Loans
(million baht) |
20,565
|
18,162
|
16,376
|
19,462
|
20,775
|
20,755
|
20,984
|
26,023
|
| Deposits
/ capita (baht) |
54,861
|
52,363
|
51,360
|
48,087
|
51,196
|
51,211
|
49,285
|
44,928
|
| Loans/deposits
ratio |
51.1 %
|
47.5 %
|
43.6 %
|
56.1 %
|
56.8 %
|
56.7 %
|
60.2 %
|
81.0 %
|
|
|
| Public
health |
2001 |
2000 |
1999 |
1998 |
1997 |
1996 |
1995 |
1994 |
1993 |
| No.
of hospitals |
19
|
21
|
20
|
20
|
19
|
19
|
20
|
20
|
18
|
| No.
of hospital beds |
1,172
|
1,219
|
1,346
|
1,346
|
1,111
|
1,053
|
996
|
818
|
742
|
| Avg.
Beds / Hospital |
61
|
58
|
67
|
67
|
58
|
55
|
49
|
40
|
41
|
| Capita
/ Hospital bed |
632
|
602
|
542
|
542
|
649
|
678
|
717
|
864
|
963
|
| No.
of physicians |
167
|
162
|
150
|
156
|
100
|
101
|
102
|
95
|
81
|
| Capita
/ Physician |
4,441
|
4,530
|
4,869
|
4,684
|
7,214
|
7,075
|
7,004
|
7,439
|
8,830
|
|
No. of dentists |
42
|
48
|
41
|
30
|
33
|
29
|
25
|
19
|
20
|
|
Capita / Dentist |
17,661
|
15,291
|
17,814
|
24,358
|
21,863
|
24,643
|
28,577
|
37,197
|
35,763
|
| No.
of nurses |
739
|
687
|
696
|
632
|
524
|
496
|
468
|
444
|
393
|
|
|
| Education |
2002 |
2000 |
1998 |
1996 |
1994 |
1993 |
| No.
of teachers |
-
|
7,175
|
7,317
|
7,105
|
7,022
|
6,954
|
| No.
of students |
-
|
136,989
|
131,998
|
127,658
|
126,859
|
123,895
|
| No.
of schools |
-
|
468
|
484
|
490
|
490
|
492
|
| No.
of classrooms |
-
|
5,445
|
5,512
|
5,512
|
5,365
|
5,217
|
| Ratio
: students / teacher |
-
|
19.1
|
18.0
|
18.0
|
18.1
|
17.8
|
| Ratio
: students / classroom |
-
|
25.2
|
23.9
|
23.2
|
23.6
|
23.7
|
|
|
| |
|


