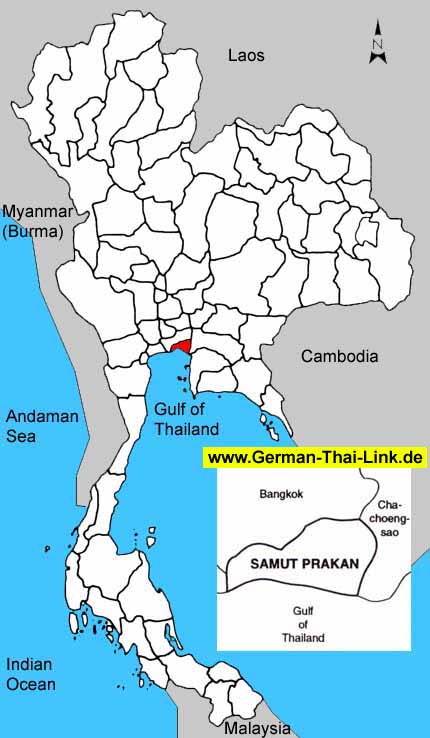
Samut Prakan, also known as Pak Nam, is situated at the end or mouth
of the Chao Phraya River at the head of the Gulf of Thailand; it is popularly
called by the people 'Muang Pak Nam'. It occupies an area of 1,004 square
kilometers, located only 25 kilometers from Bangkok. Samut Prakan was
established in the Ayutthaya period having the original site at Amphoe
Phra Pradaeng and called Muang Phra Pradaeng. During the reign of King
Rama II, he commanded to have Muang Samut Prakan be reestablished at Tambon
Pak Nam in the year 1819 and it took three years to complete.
Phra Chulachomklao Fortress, popularly called by the people 'Pom Phra
Chun', was constructed during the reign of King Rama V in the year 1893,
and is located seven kilometers from Phra Samut Chedi on Suksawat Road.
The Royal Thai Navy sank a French warship, invading Thai waters, by firing
from this fortress. The binoculars and the ancient cannons are still kept
in this fortress and a visit can be made with a permit issued by the Public
Relations Section, The Royal Thai Navy.
Ancient City, located in the vicinity of Tambon Bang Pu Mai, Amphoe Muang
at Km. 33.5 of Sukhumvit Road, house replicas of important places of worship
of various provinces. Some of those are miniaturized and some are actual
sizes.
|
| General
Information |
| Area
sq km |
1,004
|
|
|
Anual
rainfall mm (2002) |
-
|
| Forest
Land (1999) |
3
|
0.3 %
|
Days
of rain (2002) |
-
|
| Farm
Land (1999) |
345
|
34.4 %
|
Mean
Temperature High/Low (2002) |
-
/
-
|
| Unclassified
Land (1999) |
656
|
65.3 %
|
BOI
Zone |
1
|
| Population
/ sq. km (2003) |
1,041
|
|
Gross
provincial product rank (2001) |
4
|
|
|
| Population |
2003 |
2002 |
2001 |
2000 |
1999 |
1998 |
1997 |
1996 |
| Male |
48.6 %
|
48.6 %
|
48.6 %
|
48.8 %
|
48.9 %
|
49.0 %
|
49.1 %
|
49.2 %
|
| Female |
51.4 %
|
51.4 %
|
51.4 %
|
51.2 %
|
51.1 %
|
51.0 %
|
50.9 %
|
50.8 %
|
| Total |
1,045,850
|
1,027,719
|
1,011,692
|
995,833
|
977,388
|
969,321
|
956,226
|
948,223
|
|
|
| Household
income (baht) |
2002 |
2000 |
1998 |
1996 |
1994 |
| Average
monthly income |
19,680
|
15,745
|
18,100
|
17,145
|
14,146
|
| Average
monthly expenditures |
14,836
|
14,297
|
14,005
|
12,421
|
12,111
|
| Voluntary
reserves |
24.6 %
|
9.2 %
|
22.6 %
|
27.6 %
|
14.4 %
|
| Monthly
income / Person |
5,622
|
5,248
|
5,484
|
5,195
|
3,823
|
| Average
household size |
3.5
|
3.0
|
3.3
|
3.3
|
3.7
|
|
|
| Gross
provincial product |
2001 |
2000 |
1999 |
1998 |
1997 |
1996 |
1995 |
1994 |
| Agriculture |
8.7 %
|
9.0 %
|
8.9 %
|
11.5 %
|
8.6 %
|
7.3 %
|
7.6 %
|
7.6 %
|
| Manufacturing |
63.9 %
|
63.7 %
|
61.4 %
|
56.7 %
|
59.9 %
|
60.0 %
|
59.9 %
|
61.1 %
|
| Construction |
1.4 %
|
1.6 %
|
1.8 %
|
1.8 %
|
2.6 %
|
6.1 %
|
5.2 %
|
4.6 %
|
| Transport
& communication |
4.1 %
|
3.9 %
|
4.0 %
|
4.1 %
|
4.7 %
|
4.2 %
|
3.9 %
|
3.3 %
|
| Wholesale
& retail trade |
6.8 %
|
7.2 %
|
7.6 %
|
7.2 %
|
7.5 %
|
6.7 %
|
6.8 %
|
7.0 %
|
| Services |
6.3 %
|
6.5 %
|
6.5 %
|
5.8 %
|
5.7 %
|
5.2 %
|
6.1 %
|
6.0 %
|
| Others |
8.8 %
|
8.1 %
|
9.8 %
|
12.9 %
|
11.0 %
|
10.5 %
|
10.5 %
|
10.4 %
|
|
|
|
|
|
|
|
|
|
| Total
(million baht) |
224,315
|
206,361
|
184,687
|
185,005
|
187,907
|
192,639
|
179,401
|
153,004
|
| GPP
per capita (baht) |
221,722
|
207,224
|
188,959
|
190,860
|
196,508
|
203,157
|
190,783
|
164,888
|
|
|
| Commercial
bank |
2003 |
2002 |
2001 |
2000 |
1999 |
1998 |
1997 |
1996 |
| No.
of offices |
120
|
120
|
118
|
124
|
93
|
93
|
91
|
84
|
| Deposits
(million baht) |
179,855
|
170,849
|
165,957
|
144,130
|
139,293
|
139,293
|
125,951
|
114,566
|
| Loans
(million baht) |
84,053
|
78,875
|
72,974
|
84,864
|
86,264
|
139,293
|
91,894
|
8,782
|
| Deposits
/ capita (baht) |
180,607
|
174,801
|
171,209
|
150,727
|
146,898
|
148,130
|
135,734
|
125,486
|
| Loans/deposits
ratio |
46.7 %
|
46.2 %
|
44.0 %
|
58.9 %
|
61.9 %
|
100.0 %
|
73.0 %
|
7.7 %
|
|
|
| Public
health |
2001 |
2000 |
1999 |
1998 |
1997 |
1996 |
1995 |
1994 |
1993 |
| No.
of hospitals |
21
|
21
|
23
|
23
|
20
|
20
|
20
|
14
|
9
|
| No.
of hospital beds |
3,328
|
3,298
|
2,188
|
2,188
|
2,953
|
2,597
|
2,241
|
1,473
|
843
|
| Avg.
Beds / Hospital |
158
|
157
|
95
|
95
|
147
|
129
|
112
|
105
|
93
|
| Capita
/ Hospital bed |
303
|
301
|
446
|
443
|
323
|
365
|
419
|
629
|
1,083
|
| No.
of physicians |
356
|
252
|
430
|
537
|
242
|
257
|
272
|
203
|
188
|
| Capita
/ Physician |
2,841
|
3,951
|
2,272
|
1,805
|
3,951
|
3,689
|
3,457
|
4,571
|
4,856
|
|
No. of dentists |
79
|
70
|
56
|
62
|
50
|
49
|
49
|
39
|
26
|
|
Capita / Dentist |
12,806
|
14,226
|
17,453
|
15,634
|
19,124
|
19,351
|
19,190
|
23,792
|
35,114
|
| No.
of nurses |
839
|
803
|
810
|
836
|
491
|
666
|
841
|
669
|
479
|
|
|
| Education |
2002 |
2000 |
1998 |
1996 |
1994 |
1993 |
| No.
of teachers |
-
|
7,963
|
7,789
|
7,429
|
7,288
|
7,306
|
| No.
of students |
-
|
184,209
|
174,712
|
170,066
|
166,031
|
160,563
|
| No.
of schools |
-
|
280
|
276
|
270
|
262
|
263
|
| No.
of classrooms |
-
|
5,156
|
5,044
|
4,895
|
4,825
|
4,734
|
| Ratio
: students / teacher |
-
|
23.1
|
22.4
|
22.9
|
22.8
|
22.0
|
| Ratio
: students / classroom |
-
|
35.7
|
34.6
|
34.7
|
34.4
|
33.9
|
|
|
| |
|

