The Province is found in history as a part of Krung Si Ayutthaya. In
the year 1636 King Prasat Thong commanded a canal dug as a short cut from
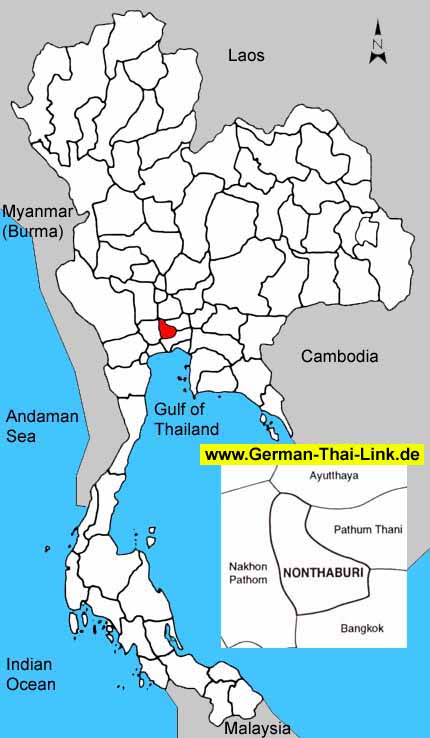
Ban Talat Khwan to the mouth of Bang Kruai Canal a total distance of five
kilometers. In the year 1665 King Narai the Great gave a royal command
to build a fortress was demolished during the reign of King Rama III to
reuse the bricks for the construction of Wat Chalerm Phra Kiat. In the
year 1928 King Phra Pok Klao gave a royal command to relocate the township
area to the present site. Nonthaburi is only20 kilometers from Bangkok,
and is conveniently accessed by both land and water transportation.
|
| General
Information |
| Area
sq km |
622
|
|
|
Anual
rainfall mm (2002) |
-
|
| Forest
Land (1999) |
-
|
-
|
Days
of rain (2002) |
-
|
| Farm
Land (1999) |
295
|
47.4 %
|
Mean
Temperature High/Low (2002) |
-
/
-
|
| Unclassified
Land (1999) |
327
|
52.6 %
|
BOI
Zone |
1
|
| Population
/ sq. km (2003) |
1,486
|
|
Gross
provincial product rank (2001) |
10
|
|
|
| Population |
2003 |
2002 |
2001 |
2000 |
1999 |
1998 |
1997 |
1996 |
| Male |
47.7 %
|
47.8 %
|
47.9 %
|
48.0 %
|
48.2 %
|
48.4 %
|
48.5 %
|
48.7 %
|
| Female |
52.3 %
|
52.2 %
|
52.1 %
|
52.0 %
|
51.8 %
|
51.6 %
|
51.5 %
|
51.3 %
|
| Total |
924,890
|
905,197
|
884,077
|
859,607
|
839,029
|
826,464
|
800,741
|
783,584
|
|
|
| Household
income (baht) |
2002 |
2000 |
1998 |
1996 |
1994 |
| Average
monthly income |
29,119
|
24,566
|
24,211
|
36,888
|
16,275
|
| Average
monthly expenditures |
22,702
|
19,088
|
19,647
|
23,365
|
13,001
|
| Voluntary
reserves |
22.0 %
|
22.3 %
|
18.9 %
|
36.7 %
|
20.1 %
|
| Monthly
income / Person |
8,564
|
7,444
|
6,371
|
10,539
|
4,282
|
| Average
household size |
3.4
|
3.3
|
3.8
|
3.5
|
3.8
|
|
|
| Gross
provincial product |
2001 |
2000 |
1999 |
1998 |
1997 |
1996 |
1995 |
1994 |
| Agriculture |
2.3 %
|
2.3 %
|
2.5 %
|
2.7 %
|
2.4 %
|
2.7 %
|
2.4 %
|
3.1 %
|
| Manufacturing |
36.7 %
|
36.6 %
|
36.7 %
|
34.1 %
|
31.3 %
|
33.0 %
|
33.1 %
|
37.1 %
|
| Construction |
4.0 %
|
3.8 %
|
5.3 %
|
9.1 %
|
17.2 %
|
20.0 %
|
22.2 %
|
12.6 %
|
| Transport
& communication |
4.7 %
|
3.8 %
|
5.4 %
|
7.2 %
|
9.1 %
|
6.0 %
|
5.0 %
|
6.3 %
|
| Wholesale
& retail trade |
10.4 %
|
13.4 %
|
14.5 %
|
12.5 %
|
12.2 %
|
11.5 %
|
11.5 %
|
12.7 %
|
| Services |
27.0 %
|
22.0 %
|
20.5 %
|
16.3 %
|
13.8 %
|
13.2 %
|
12.2 %
|
13.8 %
|
| Others |
14.9 %
|
18.1 %
|
15.1 %
|
18.1 %
|
14.0 %
|
13.6 %
|
13.6 %
|
14.4 %
|
|
|
|
|
|
|
|
|
|
| Total
(million baht) |
83,301
|
81,924
|
78,590
|
83,948
|
88,150
|
81,758
|
73,835
|
56,347
|
| GPP
per capita (baht) |
94,223
|
95,304
|
93,667
|
101,574
|
110,085
|
104,338
|
94,862
|
74,122
|
|
|
| Commercial
bank |
2003 |
2002 |
2001 |
2000 |
1999 |
1998 |
1997 |
1996 |
| No.
of offices |
98
|
95
|
94
|
94
|
75
|
75
|
71
|
66
|
| Deposits
(million baht) |
155,651
|
131,807
|
134,159
|
142,853
|
119,673
|
119,673
|
103,697
|
104,350
|
| Loans
(million baht) |
45,294
|
41,301
|
35,925
|
43,902
|
44,470
|
44,470
|
47,050
|
49,080
|
| Deposits
/ capita (baht) |
181,072
|
157,094
|
162,328
|
178,401
|
152,725
|
153,755
|
136,410
|
141,150
|
| Loans/deposits
ratio |
29.1 %
|
31.3 %
|
26.8 %
|
30.7 %
|
37.2 %
|
37.2 %
|
45.4 %
|
47.0 %
|
|
|
| Public
health |
2001 |
2000 |
1999 |
1998 |
1997 |
1996 |
1995 |
1994 |
1993 |
| No.
of hospitals |
15
|
18
|
17
|
17
|
17
|
13
|
10
|
10
|
10
|
| No.
of hospital beds |
4,767
|
5,163
|
5,558
|
5,558
|
5,376
|
3,127
|
879
|
1,112
|
868
|
| Avg.
Beds / Hospital |
317
|
286
|
326
|
326
|
316
|
240
|
87
|
111
|
86
|
| Capita
/ Hospital bed |
185
|
166
|
150
|
148
|
148
|
250
|
885
|
683
|
851
|
| No.
of physicians |
301
|
279
|
256
|
245
|
286
|
445
|
604
|
616
|
243
|
| Capita
/ Physician |
2,937
|
3,081
|
3,277
|
3,373
|
2,799
|
1,760
|
1,288
|
1,234
|
3,042
|
|
No. of dentists |
81
|
81
|
51
|
52
|
60
|
106
|
152
|
154
|
45
|
|
Capita / Dentist |
10,914
|
10,612
|
16,451
|
15,893
|
13,345
|
7,392
|
5,120
|
4,936
|
16,428
|
| No.
of nurses |
1,213
|
1,135
|
1,114
|
918
|
1,069
|
1,409
|
1,749
|
1,776
|
822
|
|
|
| Education |
2002 |
2000 |
1998 |
1996 |
1994 |
1993 |
| No.
of teachers |
-
|
7,054
|
7,112
|
6,748
|
6,580
|
6,446
|
| No.
of students |
-
|
146,912
|
135,821
|
122,968
|
117,906
|
112,317
|
| No.
of schools |
-
|
257
|
252
|
251
|
240
|
239
|
| No.
of classrooms |
-
|
4,068
|
4,052
|
3,874
|
3,750
|
3,650
|
| Ratio
: students / teacher |
-
|
20.8
|
19.1
|
18.2
|
17.9
|
17.4
|
| Ratio
: students / classroom |
-
|
36.1
|
33.5
|
31.7
|
31.4
|
30.8
|
|
|
| |
|

