 |
| General
Information |
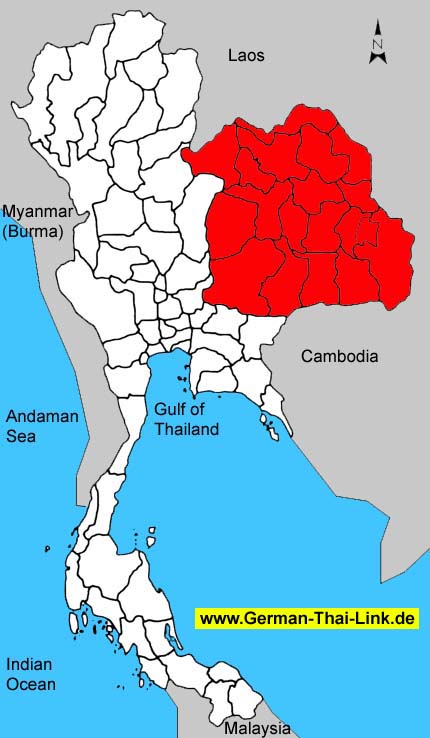
| Area
sq km |
168.765
|
|
|
Anual
rainfall mm (2002) |
1.663
|
| Forest
Land (1999) |
20.887
|
12,4 %
|
Days
of rain (2002) |
123
|
| Farm
Land (1999) |
92.715
|
54,9 %
|
Mean
Temperature High/Low (2002) |
32,9
/
22,6
|
| Unclassified
Land (1999) |
55.163
|
32,7 %
|
BOI
Zone |
-
|
| Population
/ sq. km (2003) |
128
|
|
Gross
provincial product rank (2001) |
-
|
|
|
| Population |
2003 |
2002 |
2001 |
2000 |
1999 |
1998 |
1997 |
1996 |
| Male |
50,0 %
|
50,0 %
|
50,0 %
|
50,0 %
|
50,0 %
|
50,1 %
|
50,0 %
|
50,1 %
|
| Female |
50,0 %
|
50,0 %
|
50,0 %
|
50,0 %
|
50,0 %
|
49,9 %
|
50,0 %
|
49,9 %
|
| Total |
21.659.798
|
21.609.165
|
21.493.681
|
21.404.751
|
21.379.428
|
21.312.166
|
21.095.841
|
20.876.054
|
|
|
| Household
income (baht) |
2002 |
2000 |
1998 |
1996 |
1994 |
| Average
monthly income |
9.189
|
7.774
|
8.514
|
7.360
|
5.581
|
| Average
monthly expenditures |
7.506
|
6.551
|
7.213
|
6.647
|
5.616
|
| Voluntary
reserves |
18,3 %
|
15,7 %
|
15,3 %
|
9,7 %
|
-
|
| Monthly
income / Person |
2.483
|
1.993
|
2.076
|
1.840
|
1.395
|
| Average
household size |
3,7
|
3,9
|
4,1
|
4,0
|
4,0
|
|
|
| Gross
provincial product |
2001 |
2000 |
1999 |
1998 |
1997 |
1996 |
1995 |
1994 |
| Agriculture |
18,9 %
|
18,0 %
|
19,6 %
|
23,2 %
|
20,6 %
|
19,9 %
|
19,8 %
|
19,2 %
|
| Manufacturing |
14,5 %
|
14,1 %
|
11,1 %
|
12,4 %
|
12,0 %
|
12,3 %
|
12,1 %
|
11,7 %
|
| Construction |
3,4 %
|
4,9 %
|
5,9 %
|
4,4 %
|
8,8 %
|
11,1 %
|
10,6 %
|
9,9 %
|
| Transport
& communication |
4,9 %
|
4,5 %
|
4,6 %
|
4,5 %
|
4,5 %
|
4,3 %
|
4,2 %
|
4,5 %
|
| Wholesale
& retail trade |
20,2 %
|
20,4 %
|
20,6 %
|
18,2 %
|
19,9 %
|
18,8 %
|
19,8 %
|
20,8 %
|
| Services |
19,6 %
|
19,3 %
|
19,0 %
|
17,9 %
|
16,4 %
|
15,7 %
|
15,9 %
|
15,6 %
|
| Others |
18,5 %
|
18,8 %
|
19,2 %
|
19,4 %
|
17,8 %
|
17,9 %
|
17,6 %
|
18,3 %
|
|
|
|
|
|
|
|
|
|
| Total
(million baht) |
580.595
|
564.501
|
737.575
|
547.492
|
557.148
|
531.859
|
495.238
|
413.810
|
| GPP
per capita (baht) |
27.012
|
26.372
|
34.499
|
25.689
|
26.410
|
25.476
|
24.056
|
20.525
|
|
|
| Commercial
bank |
2003 |
2002 |
2001 |
2000 |
1999 |
1998 |
1997 |
1996 |
| No.
of offices |
475
|
474
|
488
|
525
|
466
|
466
|
467
|
444
|
| Deposits
(million baht) |
266.720
|
253.990
|
253.441
|
220.079
|
232.678
|
232.686
|
227.375
|
216.397
|
| Loans
(million baht) |
198.090
|
193.072
|
173.441
|
233.919
|
251.768
|
251.767
|
280.181
|
274.189
|
| Deposits
/ capita (baht) |
12.460
|
11.880
|
11.891
|
10.432
|
11.145
|
11.302
|
11.278
|
11.061
|
| Loans/deposits
ratio |
74,3 %
|
76,0 %
|
68,4 %
|
106,3 %
|
108,2 %
|
108,2 %
|
123,2 %
|
126,7 %
|
|
|
| Public
health |
2001 |
2000 |
1999 |
1998 |
1997 |
1996 |
1995 |
1994 |
1993 |
| No.
of hospitals |
341
|
339
|
339
|
337
|
338
|
322
|
315
|
303
|
296
|
| No.
of hospital beds |
27.819
|
27.163
|
27.376
|
26.859
|
25.802
|
23.627
|
21.452
|
18.021
|
17.047
|
| Avg.
Beds / Hospital |
81
|
80
|
80
|
79
|
76
|
73
|
68
|
59
|
57
|
| Capita
/ Hospital bed |
772
|
788
|
780
|
793
|
817
|
883
|
959
|
1.118
|
1.147
|
| No.
of physicians |
2.817
|
2.574
|
2.632
|
2.582
|
2.109
|
1.992
|
1.884
|
1.873
|
1.879
|
| Capita
/ Physician |
7.629
|
8.315
|
8.122
|
8.254
|
10.002
|
10.479
|
10.927
|
10.763
|
10.411
|
|
No. of dentists |
660
|
603
|
555
|
477
|
460
|
456
|
462
|
464
|
395
|
|
Capita / Dentist |
32.566
|
35.497
|
38.521
|
44.679
|
45.860
|
45.780
|
44.560
|
43.450
|
49.529
|
| No.
of nurses |
14.320
|
12.566
|
12.513
|
11.473
|
9.841
|
9.448
|
9.065
|
8.211
|
7.780
|
|
|
| Education |
2002 |
2000 |
1998 |
1996 |
1994 |
1993 |
| No.
of teachers |
-
|
199.005
|
197.081
|
190.599
|
189.501
|
192.105
|
| No.
of students |
-
|
4.064.540
|
4.073.745
|
4.244.554
|
3.776.970
|
3.678.341
|
| No.
of schools |
-
|
14.568
|
14.563
|
14.371
|
19.250
|
14.694
|
| No.
of classrooms |
-
|
162.443
|
160.287
|
157.829
|
149.141
|
149.199
|
| Ratio
: students / teacher |
-
|
20,4
|
20,7
|
22,3
|
19,9
|
19,1
|
| Ratio
: students / classroom |
-
|
25,0
|
25,4
|
26,9
|
25,3
|
24,7
|
|
|
| |
|

